
Written by: Matt Beucler, CEO, Plura AI
Key Takeaways
- Lead response time is the elapsed time between a lead’s first signal of interest and the first meaningful contact from sales. Dashboards need median, P90, and the percentage contacted within 5, 15, and 60 minutes to report an honest number.
- Four integrity traps in most CRM and marketing systems inflate performance: auto-acknowledgment emails, business-hours clocks, timezone mismatches, and CRM sync delays. Cleaning these up at data capture keeps the number honest.
- Segmentation by lead source, rep, time of day, and business vs. after-hours exposes routing failures that a blended average hides. Clear segmentation turns metrics into specific fixes instead of generic performance pressure.
- Bucketing leads by response-time windows and plotting conversion rates for under 5 minutes, 5–15 minutes, 15–60 minutes, 60+ minutes, and never contacted creates a revenue story leadership can fund.
- Plura AI instruments first contact at the infrastructure layer. Its AI voice, SMS, RCS, and webchat channels respond in under 5 seconds, eliminating sync lag and giving teams 90% faster response times plus 47% average pipeline growth.2
Lead Response Time Metrics That Belong on Your Dashboard
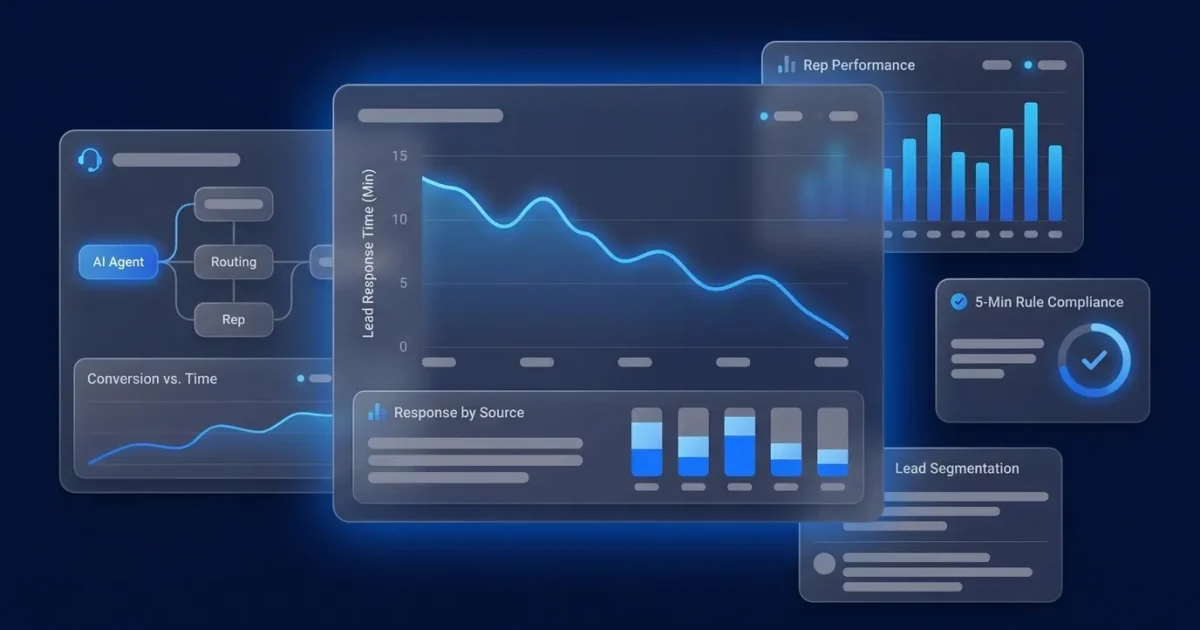
A complete lead response time dashboard needs nine measurements that work together. They cover central tendency, tail risk, and segmentation so you see the real experience behind the averages.
| Metric | Definition | Why It Matters |
|---|---|---|
| Median Lead Response Time | The middle value when all individual response times are sorted from shortest to longest. | A single lead contacted three days late can drag the mean far above what a typical lead actually experiences, which is why the median is the honest headline number.3 |
| Percentage of Leads Contacted Within 5 Minutes | (Leads contacted within 5 minutes ÷ total leads) × 100. | In one 2026 study, only about 7% of B2B teams respond to inbound leads within five minutes, though other samples found 23% and 26%. This threshold moves conversion most directly. |
| Percentage of Leads Contacted Within 15 Minutes | (Leads contacted within 15 minutes ÷ total leads) × 100. | Captures the secondary response window for teams that cannot hit 5 minutes on every source and supports an SLA tier for medium-intent leads. |
| Percentage of Leads Contacted Within 60 Minutes | (Leads contacted within 60 minutes ÷ total leads) × 100. | Firms that tried to contact leads within an hour were nearly seven times as likely to qualify the lead as those that tried an hour later. |
| Uncontacted Lead Rate | (Leads that received zero contact attempts ÷ total leads) × 100. | A 2024 secret-shopper test found 63.5% of B2B SaaS companies never replied to a demo request at all. This metric makes that failure visible. |
| 90th-Percentile (P90) Response Time | The response time at or below which 90% of leads were contacted. The remaining 10% waited longer. | A 4-minute median with a 19-hour P90 means after-hours and weekend leads are being quietly abandoned. |
| Response Time by Lead Source | Median and P90 response time calculated separately for each acquisition channel (for example, paid search, organic, referral, event). | Segmenting by source surfaces routing bottlenecks that a blended average conceals. |
| Response Time by Rep | Median response time from lead assignment to first contact attempt, calculated per assigned rep. | Separates rep-level delays from routing delays so you can apply targeted fixes instead of blanket pressure. |
| Conversion Rate by Response-Time Bucket | Lead-to-opportunity or lead-to-close rate calculated for each response-time cohort (under 5 min, 5–15 min, 15–60 min, 60+ min, never contacted). | Leads contacted within five minutes convert at roughly 21%, versus 2.3% for leads contacted after 24 hours.2 This metric turns a response-time number into a revenue argument. |
See how your current response times translate into pipeline with Plura’s ROI calculator.
How to Calculate Lead Response Time Metrics
The formulas below move from the simplest calculation to the most diagnostic. Reporting the naive average alone hides the real story.
Naive Average (baseline only):
Sum of all individual response times ÷ number of leads contacted.
Use this as a trend baseline. A team with a 6-minute average response time can still have 20% of leads waiting 45 minutes or longer. The average hides that gap.
Median (the honest headline number):
Sort all response times from shortest to longest. The median is the middle value. For an even number of records, average the two middle values.
A single lead contacted three days late can drag the mean far above what a typical lead actually experiences, which is why the median is the honest headline number.
90th Percentile (P90):
Sort all response times from shortest to longest. Multiply the total number of records by 0.90. Round up to the nearest whole number. The response time at that position in the sorted list is the P90.
Plain language: the P90 is the time by which 90% of leads were contacted. It is the right metric for SLA and tail-risk analysis. The 10% of leads that waited longer than the P90 are where after-hours gaps and routing failures concentrate.
Percentage Within a Window:
(Leads contacted within X minutes ÷ total leads) × 100.
Calculate this for each threshold on your dashboard: 5 minutes, 15 minutes, and 60 minutes. Track the uncontacted rate separately as (leads with zero contact attempts ÷ total leads) × 100, because leads that were never contacted have no response time and stay invisible in every average.
Why Many Lead Response Time Numbers Are Wrong
Even with the right formulas, your dashboard can still report a number that is wrong. Four integrity traps distort lead response time data in most CRM (Customer Relationship Management) and marketing automation systems, and each one makes the dashboard look better than reality.
Automated Acknowledgment Emails Inflating First Contact
“First meaningful contact” is a call, a personalized email, a text, or a chat session in which a human or AI agent actually engages the lead’s question. An automated confirmation email does not count as a lead response because it cannot answer a question, qualify, or book time. If your CRM logs the auto-responder timestamp as the first contact, your dashboard is reporting the time to send a template, not the time to start a conversation.
The fix has two parts. First, define “first meaningful contact” explicitly in your CRM so the system knows which events qualify. Then create a separate field for auto-acknowledgment timestamps and exclude those events from the response-time calculation so the auto-responder cannot be mistaken for a human or AI agent.
Business-Hours vs. Calendar-Hours Clocks
A lead arriving at 6 p.m. Friday and called at 9 a.m. Monday is either 63 calendar hours or 0 business hours, depending on which clock your dashboard uses. Measuring only business hours understates response time, because the lead experienced 63 hours of waiting regardless of how many of those hours your team was open. Your dashboard must declare which clock it uses. Calendar hours are the honest default for any operation without 24/7 coverage, because they reflect what the lead actually experienced.
Timezone Errors Between Lead Capture and Rep Activity
Timezone-aware scheduling requires detecting the lead’s timezone and normalizing timestamps to local time rather than relying on raw server timestamp ordering. A form submitted at 11 p.m. Eastern by a lead in New York, processed by a server in Pacific time, and assigned to a rep in Central time can produce a response-time calculation that is off by hours before anyone touches the record. Audit your form submission timestamps, CRM record creation timestamps, and rep activity timestamps for timezone consistency.
Routing Timestamps That Record the Wrong Lead-Creation Time
CRM sync delays can add 5 to 30 minutes to the measured response time when the clock starts at CRM record creation rather than form submission. The clock for lead response time should start at submission, not at CRM record creation, because integration lag hides in that gap. If your marketing automation platform syncs to your CRM on a 15-minute batch cycle, a reported “5-minute response” is actually 20 minutes from the lead’s perspective. Fix this by capturing the form submission timestamp at the source and passing it as a dedicated field to the CRM, separate from the CRM record creation timestamp.
Lead Response Time Metrics Template and Worked Example
The right CRM fields give you clean, auditable lead response time measurement. Create each field as a dedicated timestamp or flag, not a calculated field that overwrites source data.
- Lead created timestamp: Form submission time, not CRM record creation time.
- First meaningful contact timestamp: First call, personalized email, text, or chat session that engages the lead’s question.
- Routing/assignment timestamp: When the lead was assigned to a rep or queue.
- Rep notification timestamp: When the rep received the alert.
- First attempt timestamp: When the rep made the first contact attempt.
- First connection timestamp: When the lead actually responded or was reached.
- Lead source: Acquisition channel (paid search, organic, referral, event, partner).
- Assigned rep: Rep ID or name at time of assignment.
- Business-hours flag: Boolean indicating whether the lead arrived during covered hours.
- Timezone: Lead’s local timezone, captured at form submission.
Worked Example (hypothetical figures only):
Assume a team processes 200 inbound leads in one month. Individual response times, in minutes, are recorded for all 200. After sorting:
- Median: The 100th and 101st values average to 11 minutes. The median lead response time is 11 minutes.
- P90: The 180th value in the sorted list is 74 minutes. Ninety percent of leads were contacted within 74 minutes.
- Percentage within 5 minutes: Forty-two leads were contacted within 5 minutes. (42 ÷ 200) × 100 = 21%.
- Uncontacted rate: Eighteen leads received zero contact. (18 ÷ 200) × 100 = 9%.
Conversion by bucket (hypothetical):
| Response-Time Bucket | Leads | Opportunities Created | Conversion Rate |
|---|---|---|---|
| Under 5 minutes | 42 | 16 | 38% |
| 5-15 minutes | 58 | 14 | 24% |
| 15-60 minutes | 52 | 7 | 13% |
| 60+ minutes | 30 | 2 | 7% |
| Never contacted | 18 | 0 | 0% |
This chart, built from real CRM data, becomes the business case for fixing your response-time infrastructure.
How Plura AI Instruments Lead Response Time at the Infrastructure Layer
The four traps above share a root cause: first contact is measured after the fact in systems that were not built to capture it. The cleanest fix is to instrument first contact at the infrastructure layer, where the timestamp is recorded at the moment of contact rather than reconstructed later.
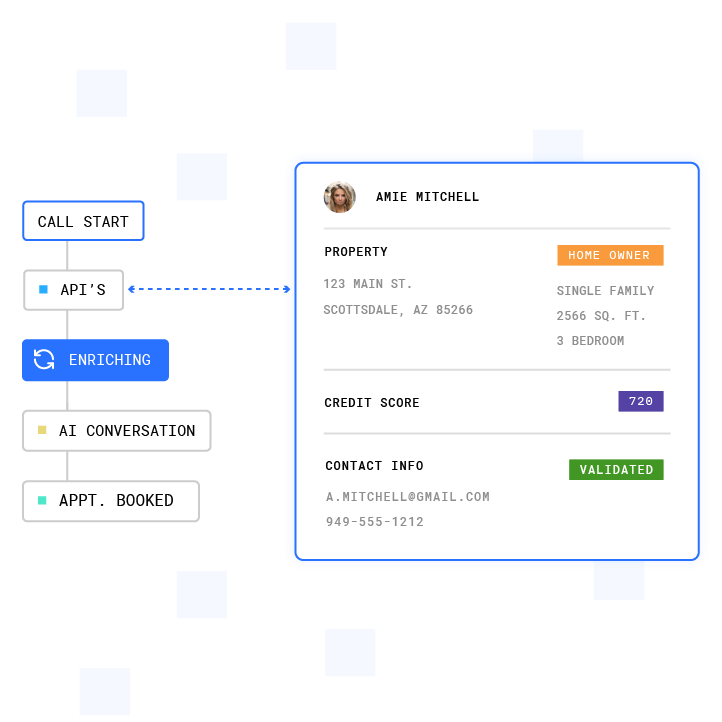
Plura AI is an FCC-licensed platform of AI voice agents, AI SMS, RCS, and AI webchat that contacts leads in under 5 seconds, versus an industry standard of 47+ hours.1 Because first contact happens inside Plura’s own FCC-licensed carrier rather than a third-party CPaaS (Communications Platform as a Service), the timestamp recorded is the real first meaningful contact, not an auto-acknowledgment email. The timestamp is recorded at the moment of first contact, so sync delay, routing lag, and timezone mismatch cannot distort it.

Plura’s AI Voice, AI SMS, RCS, and AI webchat all share the same stateful conversation database. That means you can measure response time by source, by channel, and by rep from one place. Conversation intelligence surfaces conversion by response-time bucket automatically, giving sales ops and marketing ops the segmentation layer without manual CRM queries. CRM integration passes the real first-contact timestamp back to HubSpot, Salesforce, or Zoho so your existing dashboards reflect the actual number.3
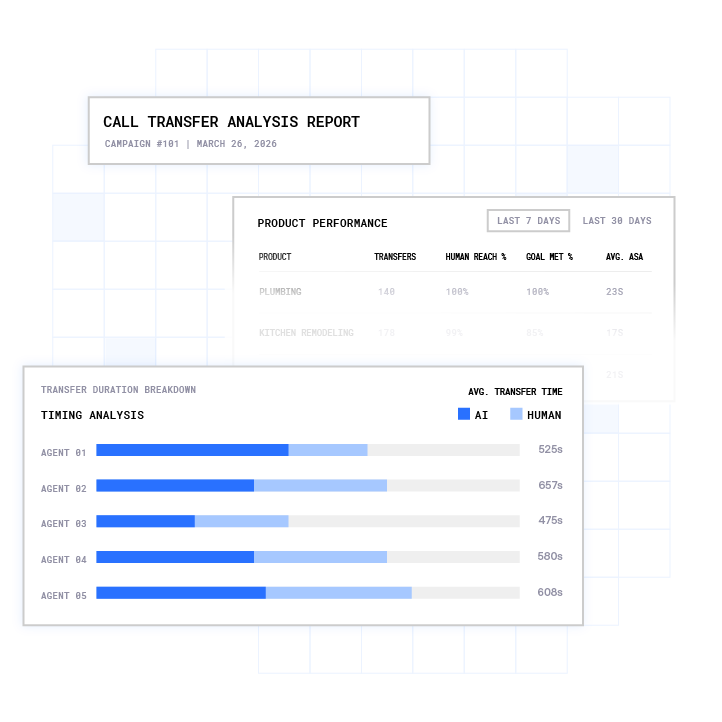
Plura customers see 90% faster lead-response time than baseline, 47% average pipeline growth, and 3x average ROI in 90 days (per Plura’s ROI calculator).2 Every annual contract includes a 90-day opt-out window.
How to Segment Lead Response Time by Source and Rep
Segmentation by lead source and by rep works as a diagnostic tool, not a performance ranking. Studies show one in four leads is routed incorrectly, meaning delay and misrouting are often the same problem. Most slow response comes from routing and process failures rather than rep motivation issues. Segmentation tells you where the routing breaks: which source, which queue, which handoff. That changes where you fix it.
For each segment, calculate the median, the P90, and the percentage inside the agreed SLA. The median shows the normal experience, while the 90th percentile shows the slow tail.
Practical segmentation cuts to build:
- By lead source: Paid search, organic, referral, event, partner. A source with a 45-minute median when others sit at 8 minutes points to a routing rule gap, not a rep problem.
- By rep: Compare median response time from assignment to first contact attempt. A rep with a high median relative to peers may have a notification problem, a queue-depth problem, or a context problem, not a motivation problem.
- By time of day and day of week: Most businesses are competent between 10 a.m. and 4 p.m. on weekdays and absent the rest of the time, which is when a meaningful share of inquiries arrive.
- By business hours vs. after-hours: After-hours inquiries represent roughly 30% of total lead volume and convert at about half the rate without proper coverage.
How to Bucket Leads by Response Time and Plot Conversion
Bucketing leads by response time and plotting conversion rate against each bucket creates the bridge from metric to revenue case. This is the one chart that turns a response-time number into a business argument leadership will fund.
The standard buckets are under 5 minutes, 5–15 minutes, 15–60 minutes, 60+ minutes, and never contacted. When you plot conversion against these buckets, the curve drops steeply at each threshold, which is the pattern that makes the revenue case. The table below shows hypothetical figures for illustration only.
| Response-Time Bucket | Hypothetical Lead-to-Opportunity Conversion Rate |
|---|---|
| Under 5 minutes | 38% |
| 5-15 minutes | 24% |
| 15-60 minutes | 14% |
| 60+ minutes | 6% |
| Never contacted | 0% |
Build this chart in your CRM by tagging each lead with its response-time bucket at the point of first contact, then running a conversion report grouped by that field. If leads contacted within 5 minutes convert at a materially higher rate than those contacted after 30 minutes, it provides a strong business case for process change.
See how Plura captures first-contact timestamps automatically. Book a demo.
Where Lead Response Time Fits Your Sales KPI Dashboard
Lead response time is a leading indicator KPI (Key Performance Indicator) that sits upstream of pipeline metrics. It belongs on the same dashboard as contact rate, qualification rate, and meeting-booked rate, because it directly controls the input to all three. Speed to lead is the time between a prospect raising their hand and your first contact attempt, and it moves conversion more than almost any other variable you control.
Speed-to-lead metrics and lead response time KPI targets should be reviewed on a weekly cadence, segmented by source. A metric reviewed quarterly surfaces as a pipeline miss you cannot explain. A metric reviewed weekly surfaces as a routing rule you can fix.
The 5-Minute Rule and the 10-3-1 Rule
The 5-minute rule originates from the Lead Response Management study led by Dr. James Oldroyd at MIT, which found the odds of making contact with a lead called within 5 minutes were roughly 100 times higher than for a lead called 30 minutes after submission, and the odds of qualifying that lead were 21 times higher. The 2011 Harvard Business Review audit of 2,241 U.S. companies confirmed that only 37% responded to a web lead within one hour, and 23% never responded at all. For Plura’s full benchmark and speed-to-lead coverage, see plura.ai/glossary/speed-to-lead.
The 10-3-1 rule describes a follow-up cadence of 10 touchpoints across the first 3 days, followed by continued contact over roughly the next month, to reach a lead before they go cold. It is a persistence framework that pairs with the 5-minute rule: speed gets the first touch, cadence gets the conversation.
Frequently Asked Questions
What Are the Statistics for Lead Response Time?
The median B2B lead response time is roughly 42 hours in several 2026 benchmark aggregations, with other samples reporting an average of about 47 hours. Roughly 35% of inbound leads wait more than 24 hours for any response, and a significant share receive no response at all. Leads contacted within five minutes convert at substantially higher rates than those contacted after 30 minutes or more. For Plura’s full benchmark coverage, see the speed-to-lead guide at plura.ai/glossary/speed-to-lead.
What Is the 5-Minute Rule for Leads?
The 5-minute rule states that contacting a lead within 5 minutes of their inquiry dramatically increases the odds of making contact and qualifying the lead, compared to waiting 30 minutes or more. The rule originates from the Lead Response Management study led by Dr. James Oldroyd at MIT in partnership with InsideSales, which analyzed more than 15,000 web-generated leads and over 100,000 call attempts. The mechanism is straightforward: five minutes after submitting a form, the prospect is still at their device and still in a buying mindset. Thirty minutes later, they are elsewhere. For Plura’s full speed-to-lead coverage, see plura.ai/glossary/speed-to-lead.
What Is the 10-3-1 Rule in Sales?
The 10-3-1 rule describes a lead follow-up cadence of 10 touchpoints across the first 3 days, followed by continued outreach over roughly the next month. It is a persistence framework designed to reach a lead before intent fades. It pairs with the 5-minute rule: speed governs the first touch, and the 10-3-1 cadence governs what happens after that first touch goes unanswered.
Should I Use Median or Average Lead Response Time?
Report the median as your headline number. As noted in the calculation section, the median is the honest headline number because a single late contact can drag the mean far above what a typical lead experiences. Track the average as a trend baseline and the P90 (90th percentile) to expose the slow tail where after-hours and weekend leads concentrate. Reporting only the average is the most common way a dashboard flatters the system.
How Do I Calculate the Percentage of Leads Contacted Within 5 Minutes?
Divide the number of leads that received first meaningful contact within 5 minutes of form submission by the total number of leads in the period, then multiply by 100. The formula is: (Leads contacted within 5 minutes ÷ total leads) × 100. The clock starts at form submission, not at CRM record creation. Exclude automated acknowledgment emails from the count; only first meaningful contact attempts qualify.
How Do I Measure Lead Response Time by Lead Source?
Tag each lead in your CRM with its acquisition source at the point of record creation. Then calculate the median and P90 response time separately for each source. Compare those figures against your SLA target for that source type. A source with a median of 45 minutes when others sit at 8 minutes points to a routing rule gap or a queue assignment problem, not a rep performance problem. Fix the routing before coaching the rep.
What Is a Good Lead Response Time KPI Target?
For high-intent inbound leads such as demo requests and pricing inquiries, a practical target is under 5 minutes during covered hours and under 15 minutes after hours. For contact form submissions, a practical target is under 1 hour. For content downloads, a practical target is same business day. Track P90 alongside the median; a P90 under 1 hour places a team in the top tier of B2B responders by current benchmarks. Set SLA targets by lead type rather than one blanket number, and review compliance weekly.
How Do I Exclude Auto-Responders From My Lead Response Time Metric?
Define “first meaningful contact” explicitly in your CRM as the first call, personalized email, text, or chat session in which a human or AI agent engages the lead’s actual question. Create a separate timestamp field for automated acknowledgment events and exclude that field from your response-time calculation. Audit your CRM activity log to confirm which event types are being captured as “first contact” and remove any auto-responder activity types from the formula. If your platform does not support this natively, a custom field populated by workflow automation is a standard workaround.
Run your numbers through Plura’s ROI calculator.
Compare plans and rates side by side.
1 This article describes regulatory frameworks at a general level and does not constitute legal advice. Laws and regulations vary by jurisdiction, change over time, and apply differently depending on facts and circumstances. Readers should consult qualified legal counsel before making compliance decisions.
2 Performance figures, customer outcomes, and industry statistics referenced in this article are drawn from cited third-party sources or Plura customer case studies. Individual results vary based on implementation, use case, industry, audience, and execution. Past or aggregate performance is not a guarantee of future results.
3 References to third-party products, services, companies, or research are made for informational and comparative purposes only. Plura AI is not affiliated with, endorsed by, or sponsored by any third party named in this article unless explicitly stated. Trademarks and product names referenced remain the property of their respective owners.
This article is provided for informational purposes only and reflects Plura AI’s understanding at the time of publication. Product capabilities, integrations, and specifications are subject to change. For the most current information, visit plura.ai.
This article was produced with the assistance of AI tools and reviewed by Plura AI prior to publication.