
Written by: Matt Beucler, CEO, Plura AI
Key Takeaways
- Live transfer agent turnover typically runs 30–45% annually and stems from structural issues like paid transfers without quality control and hostile prospects who never opted in.3
- Core churn drivers include unrealistic TPH quotas, sub-minute recovery time between hostile calls, incentive-heavy compensation, and the absence of any career path from the transfer seat.
- Each departing agent can cost $10,000–$46,000 when you factor in wasted paid leads, ramp time, lost productivity, and management overhead.3
- Traditional retention tactics such as pizza parties and generic bonuses only trim attrition at the margin and leave the underlying rejection load in place.
- Plura AI’s AI voice agents qualify leads and absorb rejection so human closers work warm, qualified buyers only, and you can see the structural fix in action.
Live Transfer Agent Turnover: The Real Benchmark
Industry research puts annual contact center agent turnover at 30–45%, with the executive-level benchmark landing at 35–45% across sectors. High-volume outbound campaigns can exceed 60% annual turnover, so live-transfer and outbound sales roles sit above the general call-center average.
The standard call center turnover formula is: separations ÷ average headcount × 100. A worked example: a 50-seat live transfer floor with 22 separations and an average headcount of 48 produces a 45.8% annual turnover rate (22 ÷ 48 × 100).
The Bureau of Labor Statistics (BLS) does not publish a turnover rate for call centers. Its Job Openings and Labor Turnover Survey (JOLTS) annual industry table has 27 rows and none covers this work. A defensible statement is a bracket: a contact center is frontline, hourly, shift-based work, so it sits above the all-industry JOLTS rate of 39.6% and plausibly near retail’s 45.6% or accommodation and food services’ 66.0%. Most disagreements about turnover figures are disagreements about the denominator and scope rather than the arithmetic. Decide once whether to count all separations or voluntary quits only, document the decision, and keep it consistent across comparisons.
WFM Labs benchmarks annual attrition for sales and collections operations at 60–100% or more, attributed to high-pressure work and commission-dependent compensation. Live transfer sits squarely in that category.
Why Live Transfer Agents Quit: Six Structural Drivers
These six drivers describe operational mechanics inside the live-transfer model. Each one explains a specific feature that pushes agents out the door.
- Paid Transfers Without Lead-Quality Control. Per-transfer pricing means the buyer pays for the transfer whether or not the case signs, so each failed transfer becomes a direct, unrecoverable economic loss. The agent did not generate the lead, cannot verify its quality, and cannot refuse the transfer. Their performance score depends on how many they convert. Every bad transfer is a rejection they absorb, and they absorb it on someone else’s dime.
- TPH Quotas That Punish Qualification Time. Live-transfer operations rely on a high-friction qualification step, so agent turnover disrupts the exact point where value is captured. The quota rewards speed over qualification, which pushes agents to transfer unqualified prospects. Unqualified transfers generate hostile callbacks. Hostile callbacks generate more rejection. The loop compounds.
- Sub-Minute Recovery Time Between Hostile Calls. The published industry occupancy ceiling of 83.3% is the measurable version of the call center treadmill that drives burnout. On a live transfer floor, the cadence is tighter. Agents move from one hostile prospect to the next with no recovery time, and the emotional labor compounds across the shift.
- Prospects Who Never Expected a Sales Call. 78% of agents cite abusive contacts as their leading source of stress, per a 2025 Call Centre Management Association study. On a live transfer, the prospect responded to an ad, a text, or a form fill. The transfer is the first time they realize they are being sold to. The agent absorbs that realization on every call.
- Incentive-Heavy Compensation and Unpredictable Income. Sales and collections operations run 60–100% or more annual attrition, attributed to high-pressure work and commission-dependent compensation. 31% of sales leaders cite unrealistic quotas as the primary cause of rep attrition, and 35% of sales leaders cite misaligned compensation as a secondary cause of quota-miss cycles.
- No Career Path From the Transfer Seat. ICMI’s 2024 State of the Contact Center report found that half of respondents said agents left to search for better positions, with lack of career growth cited as a primary reason.4 Lack of development opportunity is consistently the top driver of contact center agent attrition. The agent who masters the transfer seat has nowhere to go except a different floor.
If your live transfer agent turnover is costing you qualified buyers, see how Plura absorbs the churn-prone transfer layer so your human closers work warm, qualified buyers only.

What a Churned Live Transfer Agent Actually Costs
The cost of a churned live transfer agent comes from three inputs: lead cost per transfer, ramp weeks to quota, and lost transfer volume during ramp.
2026 live transfer lead pricing varies widely by vertical: Medicare $40–$90 per transfer, final expense $35–$75, life insurance $80–$180, mortgage $80–$250, auto insurance $25–$60, and ACA health $40–$90. Those prices matter because new call center agents take 3 to 6 months to reach full proficiency and operate 30% to 50% below a tenured agent’s productivity in the first 90 days. Every transfer a ramping agent fails to convert is a paid lead that produced no revenue.
Worked example: a final expense floor running transfers at $55 per transfer, with a new agent ramping over 8 weeks to full TPH quota, operating at 50% productivity during ramp. If the agent would have handled 40 transfers per week at full productivity, the ramp loss is 40 transfers per week × 8 weeks × 50% = 160 lost transfers. At $55 per transfer, that is $8,800 in wasted paid leads before recruiting, training, and supervisor time.
McKinsey research puts the true cost of replacing a departing contact center agent at $10,000 to $20,000.3,4 Many executives estimate replacement costs at only $3,000–$5,000 per agent. The gap is largely driven by lost productivity during the ramp period. SHRM’s 2022 Talent Access Report (n=472) puts average cost per hire at $4,683 with a $1,244 median, and SHRM’s 2025 Recruiting Benchmarking report puts the median for nonexecutive roles at $1,200.4
In-House vs. Outsourced Live Transfer Agents: Turnover Dynamics Differ
The in-house vs. outsourced decision changes who absorbs the churn cost, not whether churn happens.
In-House. In-house call centers are the most stable segment with 33–39% annual turnover. ContactBabel’s 2025–2026 US Contact Center Decision-Makers’ Guide puts average front-line agent attrition at 22% for in-house teams. You control lead quality, TPH quotas, and schedule flexibility. You also absorb the full cost of every departure.
Outsourced. Outsourced call centers experience the highest turnover at 49–53% annually. ContactBabel’s 2025–2026 guide puts outsourced programs at 38% average front-line agent attrition, and outsourced BPO programs often face higher churn in practice because they rely on shared agent pools and less stable staffing models. The vendor absorbs the recruiting and training cost. You inherit the quality variance that comes with a constantly-ramping floor.
Neither model eliminates the churn driver. Both models pay for it. The size of that cost, however, depends on the vertical.
Live Transfer Agent Turnover by Vertical
Churn drivers vary by vertical. The following breakdown uses published transfer pricing and close-rate data to show where the rejection load is heaviest. The pattern across verticals is clear: higher lead cost paired with lower close rate makes each rejection more expensive for the agent and the business.
Final Expense. Final expense transfers run $35–$75 per transfer with close rates of 15–25%. The prospect is often a senior who did not expect a sales call. The agent absorbs the hostility on a paid transfer they cannot control. The churn driver is strongest here.
Medicare. Medicare transfers run $40–$90 per transfer with close rates of 18–28%. The Annual Enrollment Period (AEP) concentrates volume and pressure into a few months. The prospect is often confused about what they are being sold to. The churn driver is strongest here alongside final expense.
Mortgage. Mortgage transfers run $80–$250 per transfer with close rates of 8–15%. The higher lead cost means every wasted transfer is more expensive. The longer sales cycle means the agent waits longer for a close, which makes incentive-heavy compensation more punishing.
Business Loan. The prospect is often a business owner who did not expect a sales call, and the qualification bar is higher. The agent absorbs rejection from unqualified prospects while being judged on transfer volume. The longer sales cycle compounds the incentive-compensation pressure. Across every vertical, the same pattern holds: the rejection load is structural. The next section separates the retention tactics that actually move attrition from the ones that do not.
Live Transfer Agent Retention: What Actually Moves Attrition
This section separates interventions that research links to lower attrition from tactics that mainly create the appearance of action.
What Works:
- Lead-Quality Filtering Before the Transfer. Per-transfer pricing aligns incentives when the buyer pays only for prospects who pass the qualification rubric and accept the warm handoff. Bad data, wrong numbers, and unqualified callers do not bill. Filtering before the transfer reduces the rejection the agent absorbs on every call.
- Realistic TPH Quotas. Best-in-class organizations aim for 60–70% quota attainment across the team. If more than 80% hit quota consistently, targets may be too low. If fewer than 50% hit, quotas are likely unfair or unrealistic. Unfair quotas lead to sandbagging and gaming, where reps push deals, hide pipeline, or manipulate timing to hit a number they can control.
- Schedule Flexibility. Operations implementing genuine schedule flexibility within coverage constraints consistently report 5–15 percentage point reductions in agent attrition. Schedule quality ranks as the top or second driver in nearly every attrition study.
- Base-Plus-Realistic-Bonus Compensation. Compensation retention levers fall into three categories: competitive base pay benchmarked against the local market, performance-based incentives aligned with quality rather than just efficiency, and sign-on bonuses paired with tenure-based pay increases. Among agents compensated at or above market, pay rarely emerges as the primary attrition driver.
- Defined Coaching Cadence. The fastest single intervention to reduce contact center attrition is typically supervisor relationship improvement, because it affects every agent on the team simultaneously and produces visible impact within 60–90 days. When team leaders dedicate over 60% of their time to on-the-floor coaching, call center staff retention rates double.
HR Theater:
- Pizza parties.
- Generic recognition programs with no operational change behind them.
- One-off retention bonuses that do not change the daily cadence of rejection.
These retention interventions do not remove the structural churn driver. They reduce attrition at the margin while the agent still absorbs rejection from unqualified paid transfers, the quota still punishes qualification time, and the seat still lacks a career path.
Running live transfer agent turnover above 40%? Run your own turnover numbers with Plura and see the structural fix in action.
The Structural Fix: Remove the Human From the Churn-Prone Layer
The churn driver sits inside the model itself. Human agents who absorb hostile, unqualified, paid-transfer volume will quit at the rate established earlier, regardless of how many retention programs you stack on top. The fix is removing the human from the layer that generates the churn, not adding another onboarding checklist.
Plura AI’s AI SMS for live transfer and AI voice agents handle the high-churn transfer layer: qualifying leads, absorbing rejection, and live-transferring warm buyers to human closers. Human agents move to closing, which is higher-value, lower-rejection work.
AI contact centers carry a 0% turnover rate compared to the benchmark for traditional operations cited earlier. That difference shows up in the cost structure: the total cost of ownership (TCO) of $700K replaces the traditional $7M contact-center cost structure. The savings come from removing the costs that turnover creates: there is no ramp curve, no recruiting cycle, and no wasted paid leads during a new hire’s first 90 days.
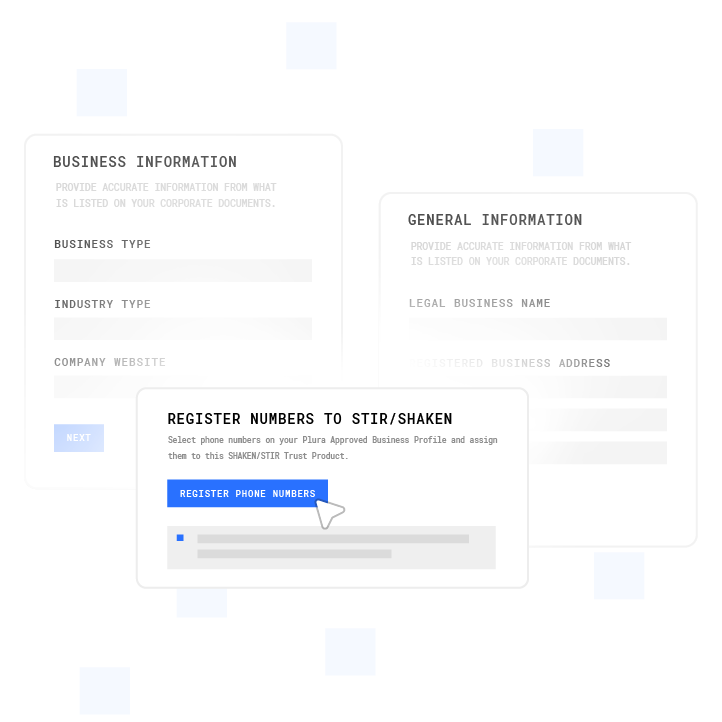
Plura runs on 100% U.S. infrastructure and owns its FCC-licensed carrier stack. Compliance enforcement for TCPA (Telephone Consumer Protection Act), DNC (Do Not Call), and SHAKEN/STIR (caller ID authentication) is built into the platform before dial.1,2 Readers should consult the relevant regulations and qualified counsel regarding their own compliance obligations.
The comparison below shows how the two models differ on the operational factors that drive churn: who absorbs rejection, how lead quality is controlled, and what happens to ramp time and turnover.
| Criteria | Human-Only Live Transfer Model | AI-Assisted Live Transfer Model |
|---|---|---|
| Who Absorbs Rejection | Human agent absorbs rejection on every unqualified or hostile transfer | AI agent absorbs rejection, and the human agent handles warm, qualified buyers only |
| Lead-Quality Control | Agent has no control over lead quality but is judged on transfer volume | AI qualifies leads before transfer, and only qualified buyers reach human closers |
| TPH Quota Pressure | Continuous TPH quota pressure punishes time needed to qualify | AI handles volume, and human closers work qualified transfers at their own pace |
| Ramp Time | 3–6 months to full proficiency, with 30–50% below tenured productivity in first 90 days | AI deploys in days with consistent performance from day one |
| Compliance Enforcement | Compliance depends on agent training and adherence; TCPA violations run $500–$1,500 per call | Compliance enforcement for TCPA, DNC, and SHAKEN/STIR built into Plura’s FCC-licensed carrier stack before dial1,2 |
| Annual Turnover | Aligned with the 30–45% benchmark for traditional operations | 0% turnover rate for AI contact centers |
Frequently Asked Questions
How Do I Calculate Live Transfer Agent Turnover Rate?
Use the standard formula: separations ÷ average headcount × 100. For example, a 50-seat live transfer floor with 22 separations and average headcount of 48 has a 45.8% annual turnover rate. Most disagreements about turnover figures are disagreements about the denominator and scope rather than the arithmetic. Decide once whether to count all separations or voluntary quits only, write the decision down, and never change it mid-comparison. If the measurement period is shorter than a year, annualize by multiplying the result by 12 divided by the number of months measured.
What Does a Churned Live Transfer Agent Actually Cost?
McKinsey research puts the true cost of replacing a departing contact center agent at $10,000 to $20,000. On a live transfer floor, add the wasted paid leads during ramp. A new agent operating at 50% productivity for 8 weeks on a floor handling 40 transfers per week at $55 per transfer loses 160 transfers, or $8,800 in wasted paid leads before recruiting, training, and supervisor time. As noted earlier, Insignia Resource’s 2026 research puts the total impact at $22,500–$46,000 per agent when lost productivity, customer impact, team morale, quality degradation, and management time are included.
Why Do Live Transfer Agents Quit More Than Inbound Agents?
Live transfer agents absorb rejection from prospects who never asked for a sales call, on paid transfers they cannot control, while being judged on transfer volume. Inbound agents handle prospects who initiated the contact. The rejection load is structurally different. The pattern mirrors the 60–100% benchmark for sales and collections cited earlier, which is attributed to high-pressure work and commission-dependent compensation. Inbound enterprise operations run 20–30%. The gap reflects the model.
In-House vs. Outsourced Live Transfer Agent Turnover: Which Is Worse?
Outsourced call centers experience the highest turnover at 49–53% annually, per Insignia Resource’s 2026 industry research, compared to 33–39% for in-house centers. ContactBabel’s 2025–2026 US Contact Center Decision-Makers’ Guide puts outsourced programs at 38% average front-line agent attrition versus 22% for in-house teams. In-house gives you control over culture, compensation, and coaching but you own the churn. Outsourced absorbs the churn but you inherit quality variance from a constantly-ramping floor. Neither model removes the structural driver.
How Do AI Agents Reduce Live Transfer Agent Turnover?
AI voice agents absorb the high-churn transfer layer: qualifying leads, absorbing rejection, and live-transferring warm buyers to human closers. Human agents move to closing, which is higher-value, lower-rejection work. Per Plura AI’s guide to AI contact centers, AI contact centers carry a 0% turnover rate compared to the benchmark for traditional operations. The churn driver is addressed structurally rather than managed around with retention programs.
Do AI Agents Replace Human Closers?
AI agents do not replace human closers. AI agents absorb the churn-prone transfer layer and hand warm buyers to humans. Teams converting to AI-assisted outbound should convert SDR headcount into closer headcount rather than cutting the team outright, since AI voice agents replace the dialing, screening, and logging layer that drives turnover while discovery, objection handling, and relationship building remain human roles.
What Is the Single Fastest Retention Intervention for Live Transfer Agents?
The fastest single intervention to reduce contact center attrition is typically supervisor relationship improvement, because it affects every agent on the team simultaneously and produces visible impact within 60–90 days. When team leaders dedicate over 60% of their time to on-the-floor coaching, call center staff retention rates double. That said, supervisor coaching does not remove the structural churn driver. It reduces attrition at the margin while the model that generates the rejection stays in place.
Conclusion: The Structural Fix for Live Transfer Agent Turnover
Live transfer agent turnover is a structural problem, not a morale problem. Human agents absorbing hostile, unqualified, paid-transfer volume will quit at the rate established earlier regardless of how many pizza parties, recognition programs, or one-off retention bonuses you add. The quota still punishes qualification time. The paid transfer still generates rejection the agent cannot control. The seat still has no career path.
The tiered retention playbook in this article moves attrition at the margin: lead-quality filtering, realistic TPH quotas, schedule flexibility, base-plus-bonus compensation, and a defined coaching cadence. These interventions are worth running, yet they do not remove the churn driver.
The structural fix is Plura AI. Plura’s AI SMS for live transfer and AI voice agents absorb the churn-prone transfer layer described above, moving human agents to closing work. The 0% turnover rate on the transfer layer reflects the result of removing the human from the layer that generates the churn.
See how Plura removes the live transfer agent turnover problem at the structural level. See how Plura removes the turnover problem at the structural level and run your own numbers.
Or use Plura’s ROI calculator to check your cost savings in real time.
Compare Plura’s plans and rates side by side.
1 Plura AI maintains SOC 2, HIPAA, ISO, and GDPR posture as part of its platform infrastructure. References to compliance frameworks in this article describe Plura’s platform capabilities and do not constitute a guarantee that any customer using Plura will themselves be compliant with applicable laws or standards. Customers remain solely responsible for their own regulatory obligations, certifications, consent management, recordkeeping, and the claims they make to their own end users. Consult qualified legal counsel for guidance specific to your use case.
2 This article describes regulatory frameworks at a general level and does not constitute legal advice. Laws and regulations vary by jurisdiction, change over time, and apply differently depending on facts and circumstances. Readers should consult qualified legal counsel before making compliance decisions.
3 Performance figures, customer outcomes, and industry statistics referenced in this article are drawn from cited third-party sources or Plura customer case studies. Individual results vary based on implementation, use case, industry, audience, and execution. Past or aggregate performance is not a guarantee of future results.
4 References to third-party products, services, companies, or research are made for informational and comparative purposes only. Plura AI is not affiliated with, endorsed by, or sponsored by any third party named in this article unless explicitly stated. Trademarks and product names referenced remain the property of their respective owners.
This article is provided for informational purposes only and reflects Plura AI’s understanding at the time of publication. Product capabilities, integrations, and specifications are subject to change. For the most current information, visit plura.ai.
This article was produced with the assistance of AI tools and reviewed by Plura AI prior to publication.