Written by: Matt Beucler, CEO, Plura AI | Last updated: August 27, 2026
Key Takeaways
- Agent utilization measures productive time against total paid hours. Most contact centers sit near a 65% global average and target 60–75% for steady performance.
- Four AI levers, including automated post-call summaries, real-time copilot, intelligent routing, and predictive WFM, can raise utilization when paired with occupancy guardrails that protect agents from burnout.
- Common drivers of low utilization include excessive after-call work, idle queue time from poor routing, inaccurate forecasting, and skills misalignment that slows resolution.
- Occupancy and utilization are distinct metrics. Maintaining 80–85% occupancy while cutting ACW and idle time improves utilization without hurting service levels or agent well-being.
- Plura AI executes this full stack on 100% U.S. infrastructure with SOC 2, HIPAA, ISO, GDPR, and TCPA support for compliance.1 Book a live demo to see how these AI levers work in your contact center.
The Cost of Low Agent Utilization
Agent utilization shows how much of every paid hour turns into customer-facing work. Operations and finance leaders use it to understand real productivity. The standard formula is:
Utilization % = (Total Handle Time + After-Call Work) / Total Paid Hours × 100
No evidence from AmplifAI states a healthy target range for agent utilization.4 Contact center benchmarks show most centers operating at an 85–88% median occupancy rate. ICMI 2025 benchmark data sets the typical customer support agent utilization rate at 65–80%.
Forrester’s Total Workforce Cost Analysis 2025 quantifies the cost of underperformance.4 Every 5-point drop in utilization below 70% adds roughly 7–8% to the fully loaded cost per productive support hour.3 For a center with 60–70% of operating costs locked into agent labor, that cost escalates quickly.
The root causes are consistent across operations. Excessive after-call work (ACW), idle queue time from poor routing, inaccurate forecasting that overstaffs off-peak intervals, and skills misalignment all reduce the share of paid time spent serving customers.
Utilization vs. Occupancy and the 30% Rule
Utilization and occupancy are related metrics, but they measure different parts of the workday. Treating them as the same metric leads to the wrong fixes.
Occupancy % = Total Handle Time / (Handle Time + Idle Queue Time) × 100
Occupancy uses only logged-in, queue-available time as its denominator. It excludes breaks, training, meetings, and unplanned absence. QueuePilot’s WFM analysis states the relationship precisely: Utilization ≈ Occupancy × (1 − Shrinkage). At 85% occupancy and 30% shrinkage, utilization lands at roughly 60%.
Shrinkage is the gap between scheduled hours and hours available for customer contacts. It includes planned activities such as training, meetings, and coaching. It also includes unplanned items such as absences, late logins, and unlogged off-phone work. WFM Labs notes that a center planning for 30% shrinkage targets approximately 70% utilization of paid time.
The 30% rule also applies to AI deflection. Routine contacts represent roughly 60% of Zendesk support tickets per eesel AI research. Deflecting about 30% of total volume to AI preserves human occupancy within the safe 80–85% band. That shift frees agents for complex work that drives first-call resolution (FCR) and customer satisfaction (CSAT).
Book a live demo with Plura to see how AI deflection and utilization diagnostics perform in a live contact center environment.
Diagnostic Workflow for Low Utilization
Low utilization has several possible causes, and the right fix depends on which factor dominates. Use this workflow to trace the problem to specific queues, call types, or CRM fields before applying any AI lever.
- Pull utilization by queue and call type. Segment utilization data by skill group, call type, and time-of-day interval. Count.co’s metric guide identifies poor workload distribution and ticket routing as primary drivers of idle time even when overall volume is adequate.
- Measure ACW as a share of handle time. Zendesk CX Trends 2025 found that AI assist reduces AHT 25–35% on routine contacts. If ACW exceeds 15–20% of handle time in your CRM data, post-call automation likely offers the highest impact.
- Identify hold-time concentration. High hold time in specific call types points to knowledge gaps that a real-time copilot can address.
- Compare forecast accuracy to actual volume by interval. Overstaffed intervals create idle time that depresses utilization even when routing and ACW look healthy. Amazon Connect’s WFM documentation notes that intraday forecasts updated every 15 minutes support more responsive scheduling.
- Audit skill-queue assignments. Blending agents across adjacent queues during idle periods absorbs excess capacity without additional hiring.
- Map shrinkage sources. Separate planned shrinkage such as training and meetings from unplanned items such as absences and adherence failures. Reducing unplanned absence can lift utilization without changing staffing levels.
Four AI Levers That Lift Utilization
AI Post-Call Summaries That Cut ACW
After-call work is often the largest controllable drag on utilization. Agents spend 3–7 minutes per contact logging outcomes, updating CRM fields, and drafting follow-up notes. Automated post-call summarization reduces that time per contact and returns minutes back to the queue. Metrigy research cited by Zoom reports a 35% ACW reduction per interaction when generative AI summarization is deployed.3
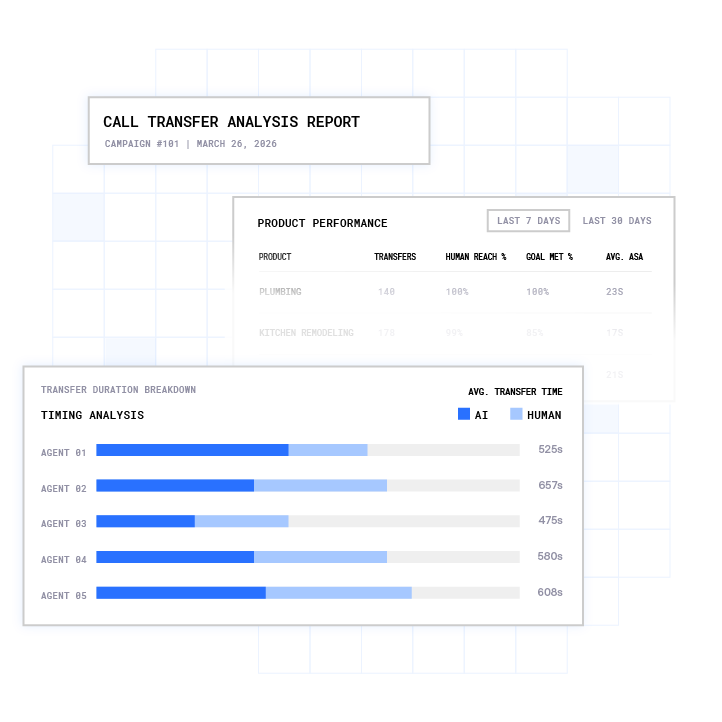
AI Rudder’s BPO analysis identifies automated call summarization as the biggest single driver of agent utilization in BPO environments. The AI populates CRM fields as soon as a call ends, so agents can move to the next interaction almost immediately.
Real-Time Copilot That Shrinks Hold and Search Time
Hold time and manual knowledge-base searches create the second major utilization drain. Metrigy research cited by Genesys and CX Today shows real-time AI agent assist reduces average handle time by about 27% by surfacing next-best-action prompts during live interactions. Real-time knowledge surfacing also cuts hold time when agents would otherwise search across multiple systems.
A joint Stanford and MIT study tracking more than 5,000 customer service agents at a Fortune 500 company found that generative AI assistance raised average productivity by 14%. Newer agents, who previously spent the most time searching for answers, saw the largest gains.
Intelligent Skill-Based Routing That Reduces Idle Time
Idle time in logged-in queues appears as an occupancy problem, but it quickly becomes a utilization problem when agents sit available yet unmatched to incoming contacts. Intelligent routing matches contact intent to agent skill in real time. This reduces the mismatch that leaves some queues overloaded while others sit empty.
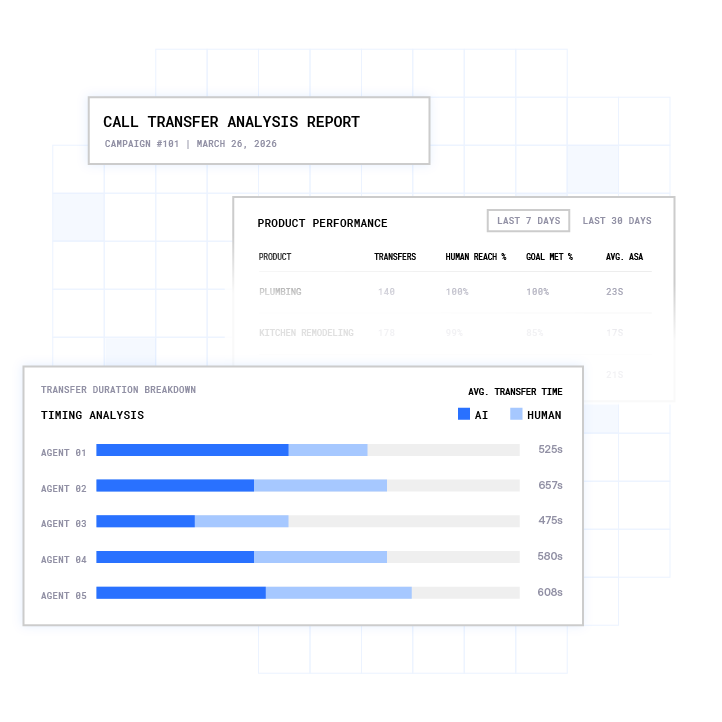
Count.co’s utilization guide recommends improving ticket routing with assignment rules based on expertise, workload, and availability, then validating the changes by tracking utilization and resolution time. Cross-training agents and tightening assignment rules prevent situations where contacts pile up in specific categories while other agents remain idle.
Predictive WFM That Aligns Staffing to Demand
Inaccurate forecasting sits upstream of both overstaffing and understaffing. Overstaffing produces idle time and low utilization. Understaffing creates occupancy spikes and burnout. ResearchGate’s publication on machine learning in workforce management documents improvements after AI-powered forecasting replaces reactive scheduling.
Calabrio’s 2025 State of the Contact Center report found that centers using AI-assisted dynamic scheduling held more intraday intervals within the target occupancy band than centers relying on static weekly schedules. Zoom research does not report specific average reductions of 28% in AHT or 29% in agent attrition for organizations using AI agent assist tools.
| AI Lever | Primary Utilization Impact | Occupancy Effect | Service Level Risk |
|---|---|---|---|
| AI-Generated Post-Call Summaries | 35% ACW reduction per contact (Metrigy/Zoom 2025) | Lowers per-contact handle time, occupancy stable or reduced | Low, reduces agent load without compressing live interaction time |
| Real-Time Copilot | 27% AHT reduction (Metrigy/Genesys 2025) | Reduces handle time per contact, more contacts per interval | Low to moderate, monitor FCR to confirm quality holds |
| Intelligent Skill-Based Routing | Reduces idle queue time, lifts occupancy toward target band | Raises occupancy in underloaded queues, requires guardrail ceiling | Moderate, must cap occupancy at 85% to help prevent burnout |
| Predictive WFM | Productivity gains vs. reactive scheduling (ResearchGate) | Narrows intraday variance, more intervals in the 80–85% band | Low, aligns staffing to demand rather than compressing agents |
| AI Deflection (routine contacts) | Lifts human utilization from baseline toward higher levels (COPC benchmarks) | Reduces human queue load, preserves occupancy headroom | Low, human agents handle complex work while AI handles routine volume |
Utilization Scorecard for Balanced Performance
A utilization scorecard tracks four quadrants at the same time. Focusing on a single quadrant without monitoring the others often produces short-term gains that reverse within a quarter.
| Quadrant | Key Metrics | Target Range |
|---|---|---|
| Capacity | Agent utilization %, shrinkage %, scheduled vs. actual hours | 60–75% utilization based on industry benchmarks, see problem section above |
| Efficiency | AHT, ACW as % of handle time, hold time per contact, FCR | ACW below 15–20% of handle time, FCR stable or improving |
| Customer | CSAT, service level (% answered within threshold), abandonment rate | Service level at 80% answered within 20 seconds is a common industry benchmark |
| Employee | Occupancy %, attrition rate, unplanned absence rate | Modern contact centers aim for an occupancy rate between 85% and 95% (Calabrio) |
Incremental Capacity Formula: When AI levers reduce AHT, the freed capacity converts into additional contacts handled without new headcount.
Incremental Contacts = (ACW Saved per Contact × Daily Contact Volume) / New AHT
Example: 3 minutes of ACW saved per contact across 1,000 daily contacts at a new AHT of 6 minutes yields 500 additional contacts per day from the same headcount. That shift represents a 50% capacity increase on that contact type.
Book a live demo with Plura to walk through the scorecard against your current utilization data.
Occupancy Guardrails by Service-Level Target
Raising utilization without occupancy guardrails often produces burnout, attrition, and weaker service levels. Calabrio’s 2025 data shows centers sustaining occupancy above 90% experience 15–20 percentage points higher annual agent attrition than centers holding at or below 85%. SQM Group’s 2025 benchmarking study found each 5-point rise in occupancy above 85% is associated with a 3–5 point drop in CSAT scores.
| Occupancy Range | Operational Status | Service Level Risk | Recommended Action |
|---|---|---|---|
| Below 70% | Understaffed or overstaffed, staffing review warranted | Low burnout risk, high cost waste | Audit routing and forecast accuracy, apply AI deflection to rebalance |
| 70–79% | Comfortable buffer, low burnout risk (ICMI 2025) | Stable service levels | Apply routing and WFM levers to move toward the 80–85% target |
| 80–85% | Industry standard target (ICMI 2025) | Balanced efficiency and agent well-being | Maintain this band and monitor intraday variance with AI-assisted WFM |
| 85–90% | Elevated fatigue risk, declining CSAT (Calabrio 2025) | Rising attrition risk, CSAT pressure | Increase AI deflection, add forced idle intervals, review staffing |
| Above 90% | Red flag, back-to-back contacts with no recovery time (Nextiva) | High error rates, burnout, accelerated turnover | Apply immediate intervention such as AI deflection, emergency staffing, or queue redesign |
Voice channels reach burnout risk at the lower end of the 85–90% range because agents handle one emotionally demanding conversation at a time. Nextiva’s guidance recommends targeting closer to 80% for high-complexity or specialized environments such as healthcare or legal. In contrast, chat and email channels can sustain higher occupancy because agents handle multiple sessions simultaneously and the asynchronous nature reduces cognitive load.
How Plura AI Supports the Full Utilization Stack
Plura AI addresses all four utilization levers on a single platform that runs on 100% U.S. infrastructure. The architecture centers on three capabilities that distinguish it from Twilio-based API resellers.
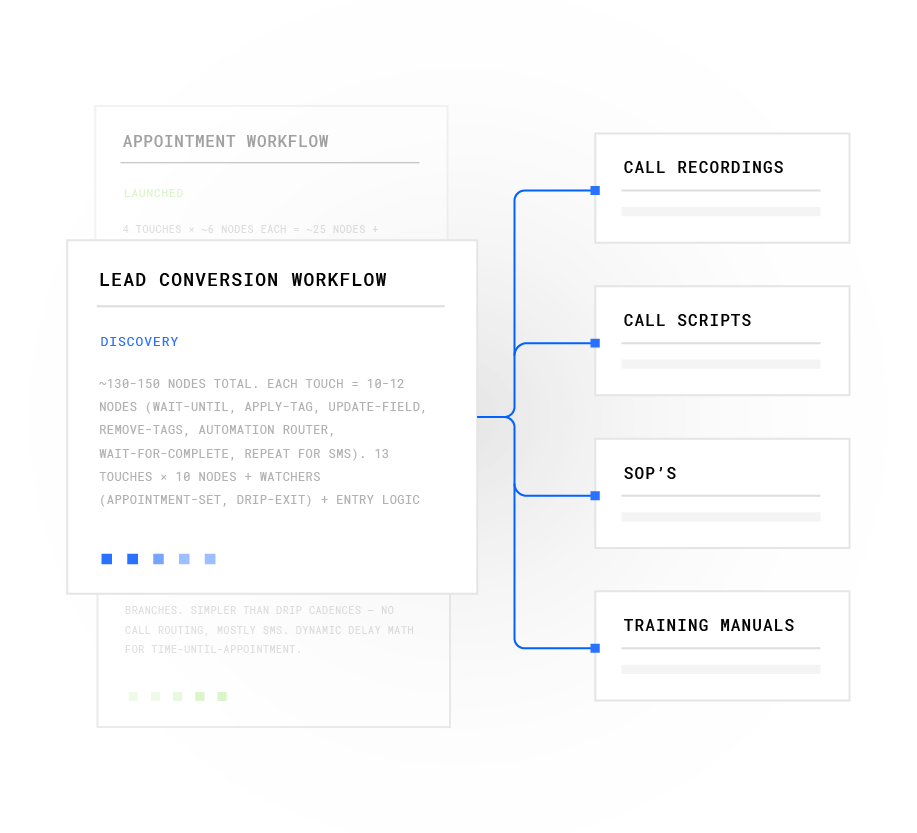
- Stateful conversation memory. Every interaction across voice, SMS, RCS, and AI webchat is keyed to a customer token and stored in one database. An agent or AI that handled a contact at 9 a.m. can pick up the call at noon already knowing what was said, what was offered, and what remains unresolved. This continuity removes repeat-explanation overhead that inflates AHT and ACW.
- Real-time routing and AI deflection. Plura’s AI Predictive Dialer and inbound routing layer match contact intent to agent skill in real time. Routine contacts such as order status, appointment confirmations, and simple qualification flow to AI agents, which helps preserve human occupancy within the 80–85% guardrail band. Plura’s AI contact center infrastructure scales quickly to handle volume spikes without the 4–8 week hiring and training cycle that traditional operations require.
- Automated wrap-up and conversation intelligence. Plura’s conversation intelligence layer generates structured interaction summaries and populates CRM fields automatically at call end. This automation removes most manual ACW. The no-code workflow builder lets operations teams configure post-call actions, disposition codes, and escalation rules without engineering support. These workflows connect to existing CRM and WFM tools through Plura’s integrations directory, which covers more than 50 tools across CRM, calendars, attribution, and data enrichment.
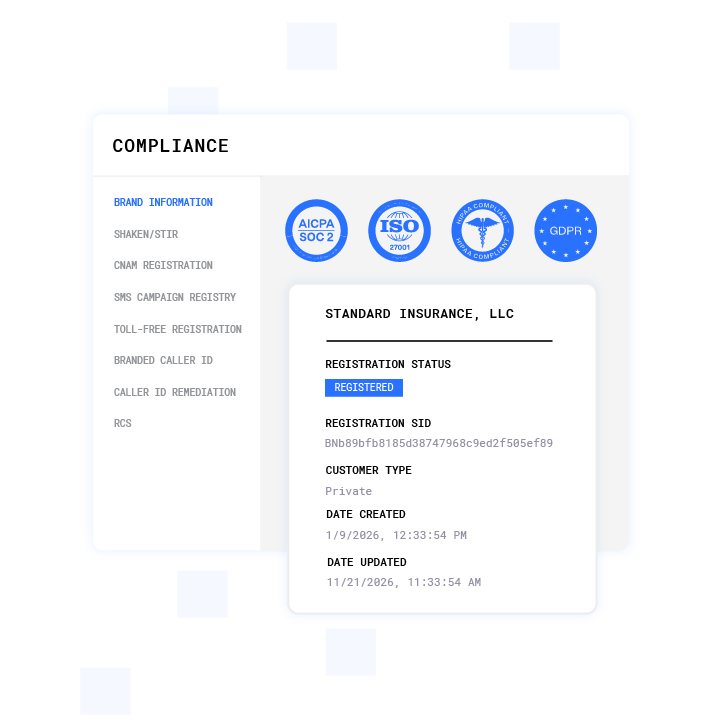
Plura supports compliance with SOC 2, HIPAA, ISO certification, GDPR, SHAKEN/STIR caller ID verification, TCPA compliance, and DNC compliance.1 Customers remain responsible for their own regulatory obligations and certifications, and Plura provides the supporting infrastructure.
Frequently Asked Questions
What is the difference between agent utilization and occupancy in a contact center?
Agent utilization measures productive time against total paid or scheduled hours. Its denominator includes the full paid shift, including handle time, after-call work, training, meetings, breaks, and unplanned absence. Occupancy measures only the share of logged-in, queue-available time spent handling contacts. The denominator excludes all off-queue activities. An agent can record 85% occupancy and 60% utilization on the same shift if shrinkage consumes 30% of paid hours. Utilization functions as the finance and capacity metric, while occupancy functions as the queue-health and burnout metric. Leaders need both metrics to diagnose low productivity accurately.
What is a healthy agent utilization rate for a contact center?
Most workforce management frameworks target 75–85% agent utilization for inbound contact centers. Rates below 60% often indicate underutilization from overstaffing, poor routing, or excessive shrinkage. Rates above 85% carry higher risk of burnout, higher attrition, declining first-call resolution, and CSAT pressure. The right target depends on interaction complexity. Centers handling emotionally demanding or technically complex contacts usually target the lower end of the range. Centers handling high-volume, short, repetitive interactions can often sustain the upper end with strong occupancy guardrails in place.
How does AI reduce after-call work time in contact centers?
AI reduces after-call work by generating structured interaction summaries and populating CRM fields automatically at call end. This shift cuts the 3–7 minutes agents often spend on manual documentation down to a brief review. The freed time converts directly into additional contacts handled per shift without adding headcount. The main body of this guide details how post-call summarization and workflow automation support that change.
What occupancy level causes agent burnout in contact centers?
Industry data consistently identifies 85% as a key inflection point. As noted earlier, occupancy above 90% drives the 15–20 point attrition increase documented by Calabrio. At 90% or higher occupancy, agents handle back-to-back contacts with no recovery time between interactions. That pattern produces longer handle times on complex contacts, higher error rates, increased unplanned absence, and faster turnover. Voice channels reach burnout risk at the lower end of the 85–90% range, and high-complexity environments such as healthcare or legal often target closer to 80%. Many inbound operations treat 70% as a practical floor, since occupancy below that level usually warrants a staffing and routing review.
Can AI raise agent utilization without degrading service levels?
AI can raise utilization without degrading service levels when leaders apply the four levers with occupancy guardrails in place. Automated post-call summaries and real-time copilot reduce handle time and ACW without compressing live interaction quality. Intelligent routing concentrates human agents on complex contacts where FCR and CSAT are most sensitive. Predictive WFM narrows intraday staffing variance and keeps more intervals within the 80–85% occupancy band. AI deflection of routine contacts reduces human queue load and preserves the idle buffer that protects service levels during volume spikes. The main risk to service levels appears when utilization rises because occupancy climbs above 85% instead of improving ACW and idle time through process changes.
Conclusion and Next Steps for Leaders
Agent utilization in many contact centers runs 10–20 points below the 75–85% healthy target. In most environments, that gap reflects process issues rather than pure staffing shortages. ACW that consumes 3–7 minutes per contact, hold time driven by knowledge gaps, idle time from mismatched routing, and forecast inaccuracy that overstaffs off-peak intervals all contribute.
The four AI levers, including automated post-call summaries, real-time copilot, intelligent skill-based routing, and predictive WFM, address each root cause directly. These levers are documented to lift utilization by 15–25 points when paired with occupancy guardrails that hold the 80–85% target band. The guardrails matter because pushing utilization by raising occupancy above 85% often produces attrition and CSAT degradation that erase efficiency gains within a quarter.
Plura executes this full stack on 100% U.S. infrastructure, with stateful conversation memory, automated wrap-up, real-time routing, and conversation intelligence built into a single platform that connects to the CRM and WFM tools already in use.
Book a live demo with Plura to map the four levers against your current utilization data and occupancy profile.
Run your numbers through Plura’s ROI calculator to estimate cost savings and capacity gains in real time.
1 Plura AI maintains SOC 2, HIPAA, ISO, and GDPR posture as part of its platform infrastructure. References to compliance frameworks in this article describe Plura’s platform capabilities and do not constitute a guarantee that any customer using Plura will themselves be compliant with applicable laws or standards. Customers remain solely responsible for their own regulatory obligations, certifications, consent management, recordkeeping, and the claims they make to their own end users. Consult qualified legal counsel for guidance specific to your use case.
2 This article describes regulatory frameworks at a general level and does not constitute legal advice. Laws and regulations vary by jurisdiction, change over time, and apply differently depending on facts and circumstances. Readers should consult qualified legal counsel before making compliance decisions.
3 Performance figures, customer outcomes, and industry statistics referenced in this article are drawn from cited third-party sources or Plura customer case studies. Individual results vary based on implementation, use case, industry, audience, and execution. Past or aggregate performance is not a guarantee of future results.
4 References to third-party products, services, companies, or research are made for informational and comparative purposes only. Plura AI is not affiliated with, endorsed by, or sponsored by any third party named in this article unless explicitly stated. Trademarks and product names referenced remain the property of their respective owners.
This article is provided for informational purposes only and reflects Plura AI’s understanding at the time of publication. Product capabilities, integrations, and specifications are subject to change. For the most current information, visit plura.ai.
This article was produced with the assistance of AI tools and reviewed by Plura AI prior to publication.