

Written by: Matt Beucler, CEO, Plura AI
Key Takeaways
-
32026 conversion rate benchmarks vary by channel and vertical, with ecommerce averaging 2.5–3.2% and B2B visitor-to-lead rates typically 2–3%.
-
Traffic source shapes performance: email and referral traffic convert at roughly 3x the rate of Meta paid social.
-
Device and visitor type matter, with desktop outperforming mobile by about 35% and returning visitors converting more often than new visitors.
-
Speed-to-lead is a critical lever, and 3responding within 60 seconds can lift conversions by 391%, far beyond traditional benchmarks.
-
Plura AI’s sub-5-second, stateful AI outreach across voice, SMS, RCS, and webchat helps operators consistently beat these benchmarks. Book a live demo to see the impact in your environment.
2026 Conversion Rate Benchmarks at a Glance
The five channels that matter most to performance marketers and contact-center leaders each carry a distinct benchmark range in 2026. 4The 2026 global average ecommerce conversion rate is 2.5–3.2%. 2026 B2B website visitor-to-lead conversion rates average roughly 2–3% overall but vary widely by industry, deal size, and funnel stage, with top performers often exceeding 5%. SaaS trial-to-paid conversion rates vary widely by trial design, with recent 2026 medians around 8% for opt-in trials and 30%+ when a credit card is required. Email automation converts at rates that vary by flow. Paid social cold traffic lands at varying rates depending on the campaign. Every number below is sourced and session-based unless noted.
These ranges are diagnostic starting points, not targets. The gap between the bottom and top of each range is where budget allocation decisions live. The table below consolidates these benchmarks by vertical and metric type so you can compare session-based ecommerce rates directly against visitor-to-lead B2B rates and trial-conversion SaaS rates.
See how sub-5-second AI outreach moves your numbers above these averages in a live demo.
2026 Conversion Benchmarks by Channel and Vertical
|
Channel / Vertical |
2026 Benchmark Range |
Metric Type |
Source |
|---|---|---|---|
|
Ecommerce (blended) |
Session-based CVR |
Acceleroi 2026 |
|
|
Ecommerce (top 20% Shopify) |
Session-based CVR |
Littledata via eightx.co 2026 |
|
|
High-ticket ecommerce ($500–$1,000 AOV) |
varies by AOV |
Session-based CVR |
Fyresite high-ticket benchmark |
|
High-ticket ecommerce ($3,000+ AOV) |
varies by AOV |
Session-based CVR |
Fyresite high-ticket benchmark |
|
B2B site (overall) |
Visitor-to-lead CVR |
GoGreyMatter 2026 |
|
|
SaaS trial-to-paid |
medians around 8% for opt-in trials and 30%+ when a credit card is required |
Trial conversion rate |
Pulseahead 2026 |
|
Email (automated flows) |
varies by flow |
Conversion rate |
Ruler Analytics Aug 2025; Klaviyo 2026 |
|
Paid social (cold traffic) |
varies by campaign |
Session-based CVR |
eightx.co / Ruler Analytics 2026 |
Is a 2% Conversion Rate Good?
Channel, vertical, and AOV (average order value) determine whether 2% is strong or weak. A 2% session-based CVR sits above the IRP Commerce May 2026 global ecommerce average of roughly 1.9%. For a high-ticket operator selling products above $3,000, a 2% rate would be exceptional.
For a B2B SaaS landing page, 2% is roughly at the average per the B2B visitor-to-lead benchmarks cited earlier. For a paid social campaign driving cold traffic, 2% sits well above typical performance and signals strong creative-to-audience fit.
The diagnostic framework stays simple. Compare your rate against the benchmark for your specific channel and AOV band, not against a blended industry average. A 2% rate on organic search traffic is mediocre. A 2% rate on Meta cold traffic is strong. The same number carries different meaning depending on where the session originated.
What Is a Good Conversion Rate in B2B?
As noted earlier, B2B visitor-to-lead rates average 2–3%, with top performers exceeding 5%. A B2B homepage converting at 2% performs at the floor. A dedicated landing page for a high-intent paid search campaign should target 4–5% to justify the cost per click in most verticals.
B2B operators face a structural disadvantage that ecommerce does not. The buying cycle is longer, the decision involves multiple stakeholders, and the conversion event is often a form fill or demo request rather than a transaction. Session-based CVR is only one diagnostic metric. Pipeline velocity, lead-to-opportunity rate, and speed-to-first-contact carry equal weight.
The industry standard for first contact on an inbound B2B lead is 47+ hours. Contacting a lead within 5 minutes makes them up to 100 times more likely to connect, and a 60-second response lifts conversions by 391% (per industry research published at plura.ai/calculator).3 For B2B operators, speed-to-lead acts as a conversion-rate lever that operates independently of traffic quality or landing page performance.
Traffic-Source Benchmarks 2026
Session-based CVR varies more by traffic source than by almost any other variable. The 2026 hierarchy across ecommerce channels, compiled from Littledata, easysellapp, eevy.ai, convertibles.dev, and adamigo.ai, ranks as follows:
-
Email and referral: 4.2% (roughly 3x the Shopify-wide blended average of 1.4%)
-
Direct: 3.0% (range 2.2–3.8%)
-
Organic search: 2.8% (range 2.1–4.0%)
-
Google paid search: 2.5% (range 1.4–3.2%)
-
Meta paid social: 1.1% (range 0.5–2.1%)
Ruler Analytics’ August 2025 benchmark, drawn from over 100 million data points, shows a slightly different ordering: direct at 3.3%, paid search at 3.2%, referral at 2.9%, organic search at 2.7%, email at 2.6%, and social media at 1.5%. The methodological difference is attribution model, not underlying behavior.
The practical implication for budget allocation is direct. Email and referral traffic convert at 2–3x the rate of paid social on equivalent session volume. This means every dollar shifted from paid social acquisition to email list growth and automation infrastructure buys more conversions at lower cost. Operators spending heavily on paid social without a parallel email automation infrastructure are paying more per conversion than necessary.
Desktop vs. Mobile Conversion Rates 2026
The device gap remains one of the most persistent and actionable splits in 2026 benchmark data. Littledata’s benchmark of 2,800 Shopify sites shows a roughly 35% conversion-rate gap between mobile (1.2% average) and desktop (1.9% average). At the top of the distribution, the gap widens, with top 10% mobile reaching 3.9%+ and top 10% desktop reaching 6.5%+.
IRP Commerce May 2026 data shows mobile accounting for the majority of ecommerce sales by device. Per Statista data, smartphones drive the majority of retail site visits and online shopping orders worldwide.
For high-AOV operators, the device split carries additional weight. High-ticket transactions are more likely to complete on desktop, where users report higher confidence in checkout security. Mobile often generates the research session, and desktop often closes the deal. Operators running high-AOV products who optimize only for mobile checkout are addressing the wrong friction point. Device type is one segmentation axis, and visitor history is another that carries equal diagnostic weight.
Returning vs. New Visitor Conversion Rates 2026
Returning visitors convert at materially higher rates than new visitors across verticals. For high-ticket ecommerce, returning visitors have already completed the initial research phase, which compresses the remaining decision cycle. The same dynamic applies in B2B. A prospect who has visited a pricing page twice and downloaded a case study is not the same conversion target as a first-time organic search visitor.
The testing-budget implication is clear. Operators who allocate CRO (conversion rate optimization) budget uniformly across new and returning visitor segments dilute their signal. Returning visitor flows warrant separate A/B test queues, separate landing page variants, and separate outreach sequences. A returning visitor who fills out a form at 11 p.m. is a materially different lead than a new visitor who bounces after 45 seconds.
SaaS Trial-to-Paid Conversion Benchmarks 2026
SaaS trial-to-paid conversion is the metric that separates product-led growth operators from those running acquisition-heavy models. SaaS trial-to-paid conversion rates vary widely by trial design. The table above shows opt-in trials converting at roughly 8% and credit-card-required trials exceeding 30%. Opt-in trials generate more trial starts but lower conversion rates depending on onboarding quality and activation depth. Credit-card-required trials convert at higher rates.
The diagnostic question for SaaS operators is not whether their trial-to-paid rate is above or below a certain threshold. It is whether their trial activation rate is high enough to make the trial-to-paid rate meaningful. A 20% trial-to-paid rate on a 10% activation rate produces worse pipeline outcomes than a 15% trial-to-paid rate on a 40% activation rate, because the absolute number of paying customers depends on both rates multiplied together. That is why both the activation and conversion steps require outreach infrastructure, not just product optimization.

How AI Outreach Changes These Benchmarks
Published benchmarks reflect what operators achieve with existing outreach infrastructure, which for most means manual SDR queues, time-zone gaps, and humans who can only work one channel at a time. The benchmarks do not represent a ceiling. They describe current average behavior.
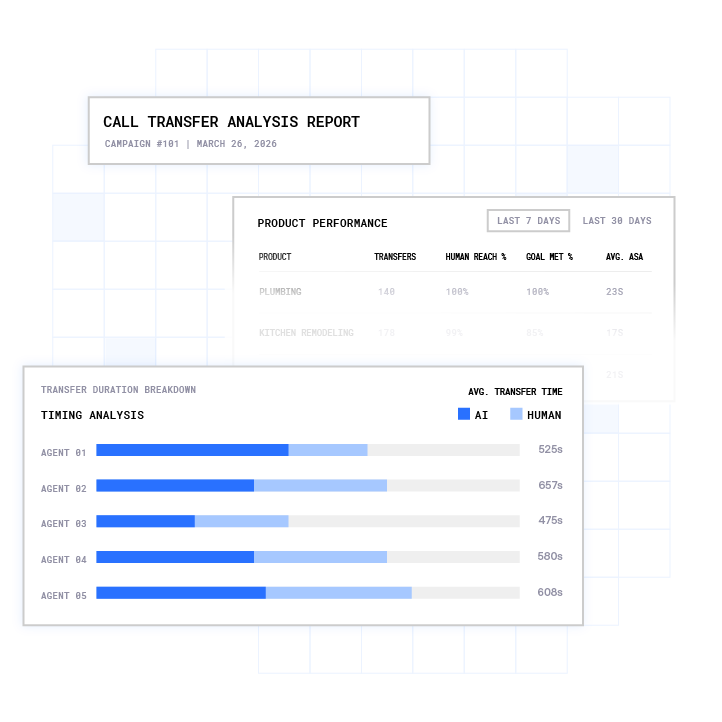
The variable that moves conversion rates most reliably is speed-to-lead. Contacting a lead within 5 minutes makes them up to 100 times more likely to connect. A 60-second response lifts conversions by 391% (per industry research at plura.ai/calculator). The industry standard for first contact remains 47+ hours. That gap is where conversion rates are lost, not on the landing page.
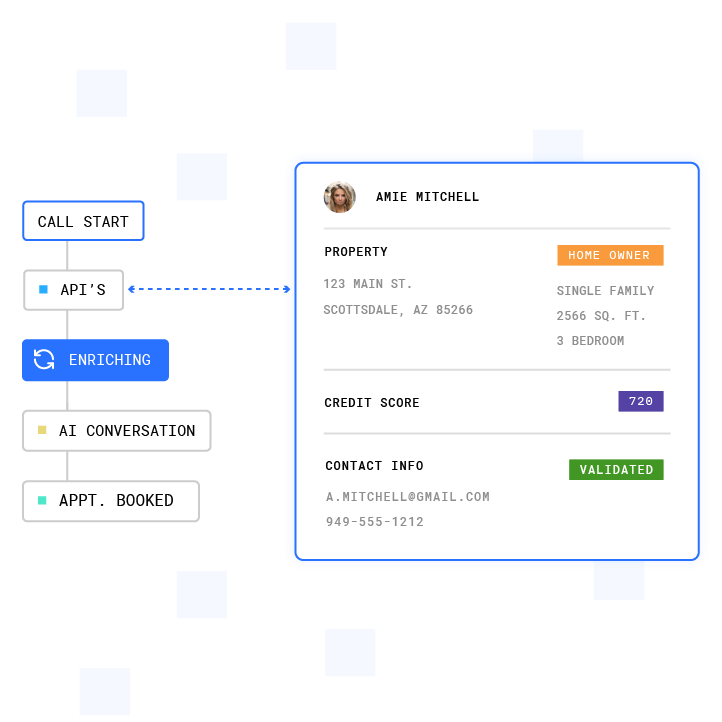
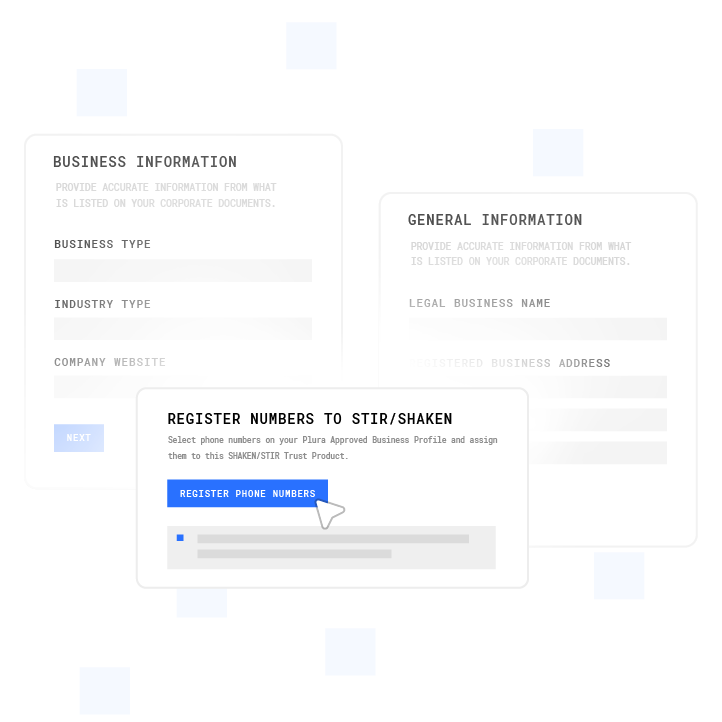
1Plura AI is an FCC-licensed platform of AI agents that contacts leads in under 5 seconds across voice, SMS, RCS (Rich Communication Services), and webchat, on 100% U.S. infrastructure. Every channel shares a Stateful Conversation Database, so an agent that texted a lead at 9 a.m. picks up the call at noon already knowing what was said. Branded caller ID and STIR/SHAKEN (caller-ID authentication) authentication increase pickup rates. Real-time DNC (Do Not Call) scrubbing and TCPA (Telephone Consumer Protection Act) litigator list filtering support compliance posture on every outbound contact.1
3Operators running Plura report 47% average pipeline growth, 90% faster lead-response time, and 3x average ROI in 90 days (per plura.ai/calculator). Those outcomes come from responding faster, on more channels, with memory-driven conversations that do not require the lead to repeat themselves.

Benchmark Sources and 2026 Update
All benchmark figures in this report are session-based CVRs unless explicitly noted as user-based or trial-based. Session-based CVR counts conversions divided by total sessions, and user-based CVR counts conversions divided by unique users. Session-based rates are lower and more conservative for high-frequency visitors.
Ecommerce figures draw from IRP Commerce May 2026 tracked-sector data, eightx.co’s 2026 traffic-source synthesis (Littledata, Statista Q1 2026), and Ruler Analytics’ August 2025 benchmark of 100 million+ data points. High-ticket figures draw from Fyresite’s high-ticket ecommerce benchmark. B2B and SaaS figures are cross-source aggregates from publicly available 2025-2026 industry reports. Email automation figures incorporate Klaviyo 2026 flow benchmarks cited in the eightx.co and propelcommerce.io sources above.
This report was last updated June 23, 2026. Benchmark figures are reviewed on a rolling basis as new platform data becomes available.
Ready to Beat 2026 Benchmarks?
Published conversion rate benchmarks describe what operators achieve with current infrastructure. Speed-to-lead, cross-channel memory, and AI-driven outreach are the variables that move performance above those averages at scale. 1Plura AI’s FCC-licensed platform contacts leads in under 5 seconds, holds stateful conversations across voice, SMS, RCS, and webchat, and supports compliance with TCPA, DNC, HIPAA, SOC 2, and 50+ state rule sets on every outbound contact.
Book a demo and see the infrastructure that moves operators above published averages.
Frequently Asked Questions
What is a good conversion rate for ecommerce in 2026?
A good ecommerce conversion rate in 2026 depends on your traffic source, AOV band, and device mix. The IRP Commerce May 2026 global average sits at roughly 1.9% session-based. The top 20% of Shopify stores reach 3.2% or higher. For high-ticket products priced above $3,000, rates are typically lower than for lower AOV items. For products in the $500–$1,000 range, rates are higher than for $3,000 items but still below the blended average in many cases. If your blended rate is below the category average, the first diagnostic step is to segment by traffic source. Email and referral traffic convert at higher rates than paid social cold traffic. A below-average blended rate often reflects a traffic mix problem, not a landing page problem.
How does speed-to-lead affect conversion rates?
Speed-to-lead is one of the highest-leverage conversion variables available to operators, and it operates independently of traffic quality or creative performance. The 5-minute and 60-second response benchmarks cited earlier show speed-to-lead operating as its own driver of conversion. The industry standard for first contact on an inbound lead remains 47+ hours. That gap is where most conversion rate losses occur. Operators who close that gap with AI outreach infrastructure consistently move above published benchmarks without changing their traffic mix or landing pages.
What is the difference between session-based and user-based conversion rates?
Session-based CVR divides conversions by total sessions, counting each visit separately even if the same user visits multiple times. User-based CVR divides conversions by unique users, giving each person one count regardless of how many sessions they generate. Session-based rates are lower and more conservative. Most ecommerce benchmarks, including IRP Commerce and Littledata data, are session-based. When comparing your internal metrics against published benchmarks, confirm which methodology your analytics platform uses. A user-based rate that looks strong may be masking a high-session, low-conversion pattern from returning visitors who are not yet ready to buy.
Why do B2B conversion rates vary so widely across the 2.0–5.0% range?
The range reflects differences in funnel stage, traffic source, and conversion event definition. The 2–3% average B2B visitor-to-lead rate mentioned earlier varies widely by industry, deal size, and funnel stage. A homepage converting at 2% performs at the floor. A dedicated landing page for a high-intent paid search campaign targeting bottom-of-funnel keywords should reach 4–5% to justify the cost per click in most verticals. The conversion event also matters. A form fill for a content download is not the same as a demo request, and both differ from a direct purchase. Operators who define conversion consistently across campaigns and compare like-for-like events get more diagnostic value from the benchmark range than those who blend all conversion events into a single rate.
How does Plura AI help operators exceed published conversion rate benchmarks?
Plura contacts leads in under 5 seconds across voice, SMS, RCS, and webchat on 100% U.S. infrastructure. Every channel shares a Stateful Conversation Database, so context from a prior SMS thread carries into a voice call without requiring the lead to repeat themselves. Branded caller ID issued through Plura’s own FCC-licensed carrier, combined with STIR/SHAKEN authentication, increases pickup rates on outbound calls. The platform’s compliance engine supports TCPA, DNC, HIPAA, SOC 2, and 50+ state rule sets on every outbound contact. Operators running Plura report 47% average pipeline growth and 3x average ROI in 90 days. Those outcomes reflect the compounding effect of faster first contact, higher pickup rates, and memory-driven conversations that move leads through the funnel without friction.
1 Plura AI maintains SOC 2, HIPAA, ISO, and GDPR posture as part of its platform infrastructure. References to compliance frameworks in this article describe Plura’s platform capabilities and do not constitute a guarantee that any customer using Plura will themselves be compliant with applicable laws or standards. Customers remain solely responsible for their own regulatory obligations, certifications, consent management, recordkeeping, and the claims they make to their own end users. Consult qualified legal counsel for guidance specific to your use case.
2 This article describes regulatory frameworks at a general level and does not constitute legal advice. Laws and regulations vary by jurisdiction, change over time, and apply differently depending on facts and circumstances. Readers should consult qualified legal counsel before making compliance decisions.
3 Performance figures, customer outcomes, and industry statistics referenced in this article are drawn from cited third-party sources or Plura customer case studies. Individual results vary based on implementation, use case, industry, audience, and execution. Past or aggregate performance is not a guarantee of future results.
4 References to third-party products, services, companies, or research are made for informational and comparative purposes only. Plura AI is not affiliated with, endorsed by, or sponsored by any third party named in this article unless explicitly stated. Trademarks and product names referenced remain the property of their respective owners.
This article is provided for informational purposes only and reflects Plura AI’s understanding at the time of publication. Product capabilities, integrations, and specifications are subject to change. For the most current information, visit plura.ai.
This article was produced with the assistance of AI tools and reviewed by Plura AI prior to publication.