
Written by: Matt Beucler, CEO, Plura AI
Key Takeaways
- A defensible call center automation ROI calculator requires six inputs: annual call volume, average handle time, fully loaded agent cost, realistic containment rate, occupancy including shrinkage, and implementation cost.
- Most public calculators inflate savings by using optimistic vendor containment rates of 67-90%, while independent benchmarks show enterprise medians around 41% and realistic post-ramp rates of 60-67%.
- Human agent talk utilization typically runs at 40% because of shrinkage, breaks, and non-productive time. AI operates at 100% utilization, so the true human-cost baseline is higher than many models show.
- Implementation costs, often omitted from public calculators, directly extend payback periods and reduce first-year ROI. Plura AI charges a transparent $2,750 per agent build fee.
- Plura AI’s ROI calculator models all critical variables with realistic assumptions and runs on 100% U.S. infrastructure, which removes offshore regulatory exposure from the comparison. Use the calculator to see how your own numbers perform.
Core ROI Formula and Required Inputs
The standard formula for call center automation ROI is straightforward. For a full walkthrough of the formula and benchmark inputs, see Plura AI’s existing guides on AI contact center economics and AI communications strategy. The six core inputs are:
- Annual call volume – total inbound and outbound contacts handled per year
- Average handle time (AHT) – the average duration of a customer interaction, including talk time and after-call work
- Fully loaded human agent cost per hour – salary plus taxes, benefits, commissions, and overhead
- Automation or containment rate – the percentage of contacts fully resolved by AI without human involvement
- Occupancy including shrinkage – the share of paid time agents actually spend handling contacts after shrinkage
- Implementation cost – one-time build, setup, and integration fees
The formula: ROI = (Annual Savings – Total Investment) / Total Investment x 100.
Some models expand this to add revenue uplift, risk avoidance, and productivity gains, but the core structure stays the same. The formula itself is not controversial. What breaks the model is the inputs, and the next sections cover the ones that most calculators get wrong.
Setting a Realistic Automation and Containment Rate
Vendor headline resolution rates typically sit between 67% and 90%, while independent aggregate data reveals significantly lower medians. Aissist.io’s AI Customer Service Benchmark 2026 documents a structural gap between vendor marketing claims and real-world field results. Advertised figures usually represent best-case outcomes, and the industry still lacks a standard definition of “resolution” and “deflection.”
Independent enterprise medians sit around 41% for tier-1 automation, with a top quartile near 59%, per Zendesk CX Trends 2026 and Salesforce State of Service 2026 data synthesized in Aissist.io’s 2026 benchmark.4 That benchmark recommends treating 60-67% as a strong horizontal benchmark, 70-75% as a strong deployment, and 80%+ as best-in-class on high-structure intent mixes.
Containment decay creates a separate modeling risk. Static deployments lose accuracy as products and policies change. New deployments typically launch at 40-50% and climb past 60% after 6-12 months of tuning, per Aissist.io’s 2026 benchmark. A calculator that assumes a static 75% containment rate from day one is modeling a best-case scenario that many enterprises reach only after a year or more, if they reach it at all.
AgentMarketCap’s April 2026 analysis documents a stage-based benchmark progression: 25-40% at initial go-live (0-3 months), 40-55% post-stabilization (3-6 months), 55-70% when optimized (6-12 months), and 70-80%+ only for best-in-class narrow use cases at 12+ months.
Check your ROI with realistic containment assumptions in Plura’s calculator.
Talk Utilization and Shrinkage in the ROI Model
Talk utilization measures the share of paid agent time spent actively handling contacts. It differs from occupancy, which divides handling time by queue-available time, and from broader utilization metrics that include all productive time. The distinction matters because a calculator that treats paid time as handling time will understate what human agents actually cost, and therefore understate the ROI of replacing them.
Plura’s ROI calculator defaults to 15 agents at $20 per hour with 25% taxes, benefits, and commissions, and 40% talk utilization. That combination produces a $60,000 monthly human cost. At 100% talk utilization with 6 Plura agents doing equivalent work, the monthly cost drops to $14,400, a $45,600 monthly difference. A calculator that assumes 100% utilization for human agents would show a much smaller gap because it would undercount how much payroll goes to non-contact time.
NiCE defines shrinkage as the percentage of scheduled agent time unavailable for handling customer contacts due to planned and unplanned non-productive activities, including breaks, lunches, training, team meetings, system downtime, and absenteeism. The formula: Shrinkage % = (Hours Lost to Non-Productive Activities / Total Scheduled Hours) x 100.
Total shrinkage across the contact center industry typically runs 25-40%, with averages around 30-35%. Healthcare and government contact centers sit at the high end, 35-45%, because mandatory training and compliance processes remove more scheduled time. Benchmarks from Calabrio and Verint show that a center that staffs to its raw forecast without a shrinkage factor will be understaffed by roughly a third of its planned capacity.
To see the effect in the model, take the default scenario: 15 agents at $20 per hour with 25% taxes and benefits. At 30% shrinkage, you need roughly 21 scheduled agents to cover the same contact volume, which raises the monthly human cost from $60,000 to about $84,000. That higher baseline is the comparison point the AI savings should use.
Modeling Implementation Cost and Payback Period
Implementation cost belongs in every ROI model because it directly affects payback period and first-year ROI. Most public calculators skip this input entirely. Omilia’s calculator, for example, states it “focuses on the savings side of the equation” and does not account for implementation costs, which vary by CCaaS platform, integration complexity, number of languages, and deployment scope.4
Payback period is calculated as Setup Cost divided by Monthly Savings, expressed in months. Some calculators adjust the divisor to express the result in weeks, but the relationship between setup cost and savings stays the same.
Plura’s agent build fee is $2,750 per agent, per the pricing page. That concrete, verifiable input belongs in the model before any savings projections are calculated. Using the default scenario from Plura’s ROI calculator, monthly savings of $45,600 against a build fee of $2,750 per agent produce a payback period measured in days. That math holds only when the savings assumption reflects realistic containment. If containment is overstated, the payback period extends in line with the lower savings.
Implementation cost also varies with conversation complexity. A simple inbound qualification flow is typically built in days. A complex multi-step intake often runs closer to one to two months because the workflow logic itself takes time to design and validate. Any model that uses a single implementation cost figure without accounting for scope is making an assumption that may not survive the first vendor conversation.
Compare Plura’s plans and rates side by side.
Sensitivity Analysis for Containment and Savings
A defensible ROI model includes a downside case that shows how results change when containment or savings fall short. At least one competitor calculator offers a three-scenario view that includes conservative, base, and aggressive cases, and other vendors also present conservative estimates. The following scenarios show how the same model behaves when containment moves from a conservative 30% to an optimized 75%. Note that payback stays under one month in two of the three cases.
- Containment drops from 60% to 30%: Savings fall and the payback period extends. A model built on a 60% containment assumption that delivers 30% in production will miss its business case by a wide margin in year one.
- AHT reduction is lower than assumed: Voice AI reduces AHT by 35-55% overall, with top-performing deployments reporting 40-55% reduction, per IrisAgent’s 2026 Voice AI Benchmarks. If a model assumes the top of that range and production delivers the bottom, labor efficiency gains shrink proportionally.
- Talk utilization is modeled at 100% for humans: The human-cost baseline drops, which shrinks apparent ROI. A model that correctly captures the utilization gap at 40% for humans versus 100% for AI shows a much larger savings figure than one that assumes equivalent utilization on both sides.
| Scenario | Containment Rate | Monthly Savings | Payback Period |
|---|---|---|---|
| Base Case | 60% | $45,600 | Under 1 month |
| Downside Case | 30% | ~$22,800 | Approximately 2 months |
| Upside Case | 75% | ~$57,000 | Under 1 month |
IrisAgent’s 2026 Voice AI Benchmarks advise using 80% of measured resolution rate as the steady-state projection when modeling ROI. That discount accounts for production variance without requiring a full sensitivity model in every presentation.
Offshore Comparison and Regulatory Cost Exposure
Any ROI model that compares AI automation against offshore BPO alternatives needs a regulatory cost line item. That line item now has specific reference points.
On March 26, 2026, the FCC adopted a Notice of Proposed Rulemaking titled “Improving Customer Service and Protecting Consumers through Onshoring” (CG Docket No. 26-52, FCC 26-16), which seeks comment on limiting the share of inbound and outbound customer-service calls routed to foreign call centers, using 30% as an illustrative threshold.2 The proposal also discusses disclosure when a call is handled outside the U.S. and restrictions on offshore handling of sensitive transactions such as password changes and financial account actions.
State-level exposure is already active. New York, New Jersey, Connecticut, Missouri, and Florida have laws or executive orders addressing offshore handling of medical, financial, and consumer data.2 Offshore BPO contracts in covered industries now carry compliance-related considerations that belong in the ROI model. Likely cost items include onshore capacity buildout, agent transfer workflows, disclosure systems, and language testing requirements.
1
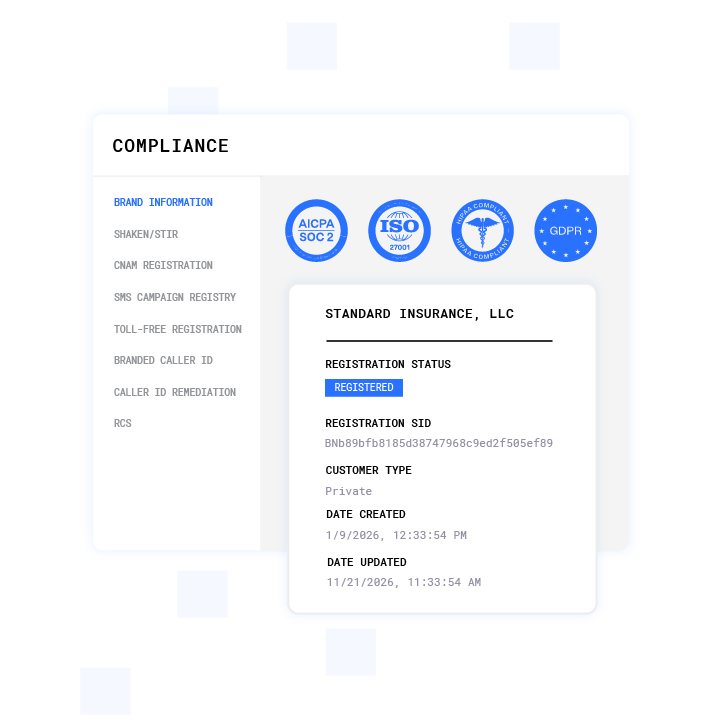
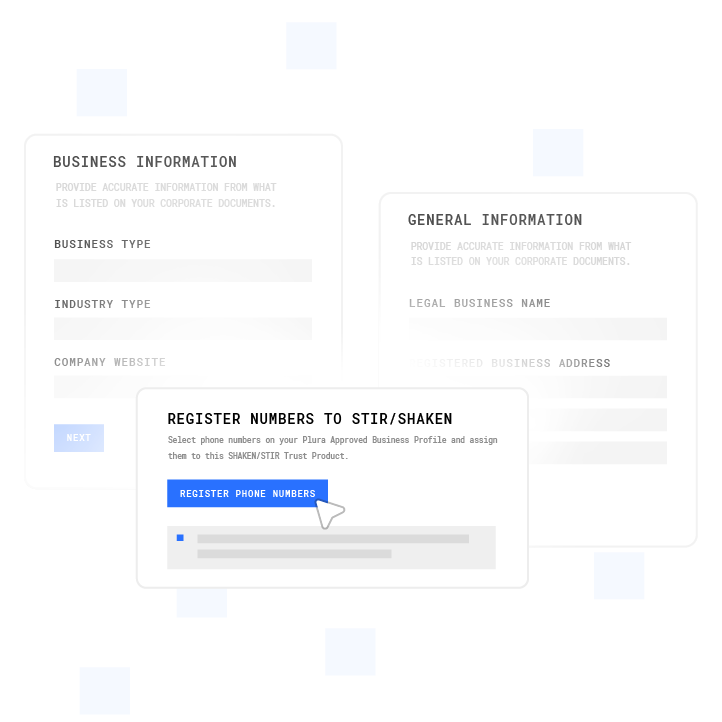
Plura runs on 100% U.S. infrastructure by architecture. Voice origination, model hosting, data storage, and call recording all sit on domestic infrastructure. Plura also owns its FCC-licensed audio bridging carrier and runs STIR/SHAKEN caller ID authentication on every outbound call.1 That architecture removes the offshore regulatory variable from the ROI model because there is no offshore routing to price in.
Plura’s ROI calculator and pricing page reflect this architecture directly. The cost comparison is against human agents on U.S. infrastructure, which keeps the model focused on operational and labor economics rather than offshore arbitrage.
How to Present the ROI Model to a CFO
A CFO will expect a model built on documented benchmarks, clear assumptions, and visible downside cases. The calculator becomes the backbone of that story when you present it in a structured way.
- Document every input source. Every benchmark needs a named, linked source. Containment assumptions should cite independent data, not vendor marketing pages.
- Run a base case and a downside case. Show both scenarios side by side so the CFO can see how the business case behaves under stress.
- Show payback period alongside annual ROI. CFOs focus on time-to-recovery. A moderate annual ROI with a short payback often looks stronger than a high annual ROI with a long payback.
- Structure the pitch around milestone-based stages. A contained pilot on one use case with explicit milestones at weeks 4, 8, and 12 is easier to approve than a full-platform commitment.
Plura’s annual contracts include a 90-day opt-out window if the deployment is not delivering. That term structure fits naturally into a milestone-based CFO presentation because it frames the first phase as a pilot with a defined exit point.
Frequently Asked Questions
What Inputs Does a Call Center Automation ROI Calculator Need?
A defensible model requires six inputs: annual call volume, average handle time (AHT), fully loaded agent cost per hour, automation or containment rate, occupancy including shrinkage, and implementation cost. Most public calculators include only the first three and use an optimistic containment assumption. The inputs that most change the output are occupancy and containment rate because both directly affect the human-cost baseline and the savings projection.
What Containment Rate Is Realistic?
The 41% enterprise median cited earlier is the number to use as a starting point, not the 70-90% vendor headline rate. From there, models can layer in stage-based benchmarks and the 60-67% strong horizontal range for mature deployments.
How Do You Calculate Payback Period?
Payback Period = Setup Cost / Monthly Savings. If implementation costs $2,750 per agent and monthly savings are $45,600, payback occurs in under one month. If containment underperforms and monthly savings drop to $22,800, payback extends to approximately two months. Payback period often resonates more with CFOs than annual ROI because it shows time-to-recovery instead of a single percentage.
How Does Implementation Cost Affect ROI?
Implementation cost reduces first-year ROI and extends the payback period. A calculator that omits this input will show an inflated first-year return, especially on complex deployments with multi-step workflows and integrations. The build fee mentioned above is the figure to enter directly into the model when you run scenarios.
Why Does Talk Utilization Matter?
Talk utilization refers to the share of paid agent time spent actively handling contacts, distinct from occupancy and broader utilization metrics. The 40% utilization default is what produces the $60,000 monthly human cost in the scenario above. AI agents operate at 100% utilization, so any model that assumes equivalent utilization on both sides will understate the savings from automation.
How Does Offshore Regulatory Cost Change the Comparison?
The FCC proposal and the state laws cited above are the regulatory items that belong in the model when you compare offshore BPO to AI. They translate into potential costs for onshore capacity, disclosure systems, transfer workflows, and language testing. Plura’s U.S.-only infrastructure removes that specific offshore routing variable from the comparison.
What ROI Can Plura Deliver?
Plura’s default scenario at plura.ai/calculator projects a 30-day ROI of $45,600, a 12-month ROI of $547,200, and a 60-month ROI of $2,736,000 when switching from 15 human agents to Plura AI agents.3 Plura reports a 3x average ROI in 90 days across its customer base, sourced to plura.ai/calculator.3 Actual results depend on call volume, containment rate, talk utilization, and implementation scope, all of which can be modeled directly in the calculator.
Run your own numbers in Plura’s ROI calculator to see how the model behaves with your inputs.
Conclusion: Build the Model, Then Stress-Test It
Public call center automation ROI calculators often return inflated savings because they omit the inputs that matter most: realistic containment assumptions, talk utilization and shrinkage, implementation cost, and the regulatory cost of offshore alternatives. A model built on vendor headline containment rates, 100% human utilization, and no implementation cost will struggle in a CFO review.
The standard formula is not the problem. The inputs are. Independent enterprise medians for tier-1 automation sit around 41%, well below the 70-90% vendors advertise. Human agents operate at roughly 40% talk utilization. Shrinkage runs 30-35% of paid time. Implementation cost changes the payback period. Offshore BPO contracts now carry regulatory considerations that belong in any honest comparison.
Plura AI’s ROI calculator is designed to model these inputs and runs on 100% U.S. infrastructure by architecture, which removes offshore routing from the equation. Annual contracts include a 90-day opt-out window, which supports a milestone-gated pilot structure instead of a long-term, all-or-nothing commitment.
Model your own containment, utilization, and shrinkage assumptions in the calculator. See what the build fee and contract terms look like on the pricing page.
1 Plura AI maintains SOC 2, HIPAA, ISO, and GDPR posture as part of its platform infrastructure. References to compliance frameworks in this article describe Plura’s platform capabilities and do not constitute a guarantee that any customer using Plura will themselves be compliant with applicable laws or standards. Customers remain solely responsible for their own regulatory obligations, certifications, consent management, recordkeeping, and the claims they make to their own end users. Consult qualified legal counsel for guidance specific to your use case.
2 This article describes regulatory frameworks at a general level and does not constitute legal advice. Laws and regulations vary by jurisdiction, change over time, and apply differently depending on facts and circumstances. Readers should consult qualified legal counsel before making compliance decisions.
3 Performance figures, customer outcomes, and industry statistics referenced in this article are drawn from cited third-party sources or Plura customer case studies. Individual results vary based on implementation, use case, industry, audience, and execution. Past or aggregate performance is not a guarantee of future results.
4 References to third-party products, services, companies, or research are made for informational and comparative purposes only. Plura AI is not affiliated with, endorsed by, or sponsored by any third party named in this article unless explicitly stated. Trademarks and product names referenced remain the property of their respective owners.
This article is provided for informational purposes only and reflects Plura AI’s understanding at the time of publication. Product capabilities, integrations, and specifications are subject to change. For the most current information, visit plura.ai.
This article was produced with the assistance of AI tools and reviewed by Plura AI prior to publication.